Build a Dashboard for Monitoring IoT Data with Initial State
Initial State allows you to stream data from your smart devices and connected applications to build beautiful IoT visualizations and real-time dashboards in the browser. In this tutorial, we'll walk through how to track and display IoT metrics to a live dashboard with our Initial State BLOCK for IoT real-time dashboards.
Initial State is a great fit for the PubNub BLOCKS Catalog. With it, you can monitor a channel (or a group of channels) that are streaming data, say, from a deployment of sensors, and visualize that data on Initial State's variety of graphs and charts. But beyond visualizing all the data coming through, BLOCKS also lets you process that data and visualize it after processing. It's incredibly flexible.
In this tutorial, we dive into a simple example of how to track and display IoT metrics from a real-time Angular2 web application with a modest 26-line PubNub JavaScript BLOCK and 92 lines of HTML and JavaScript. It'll look like this:
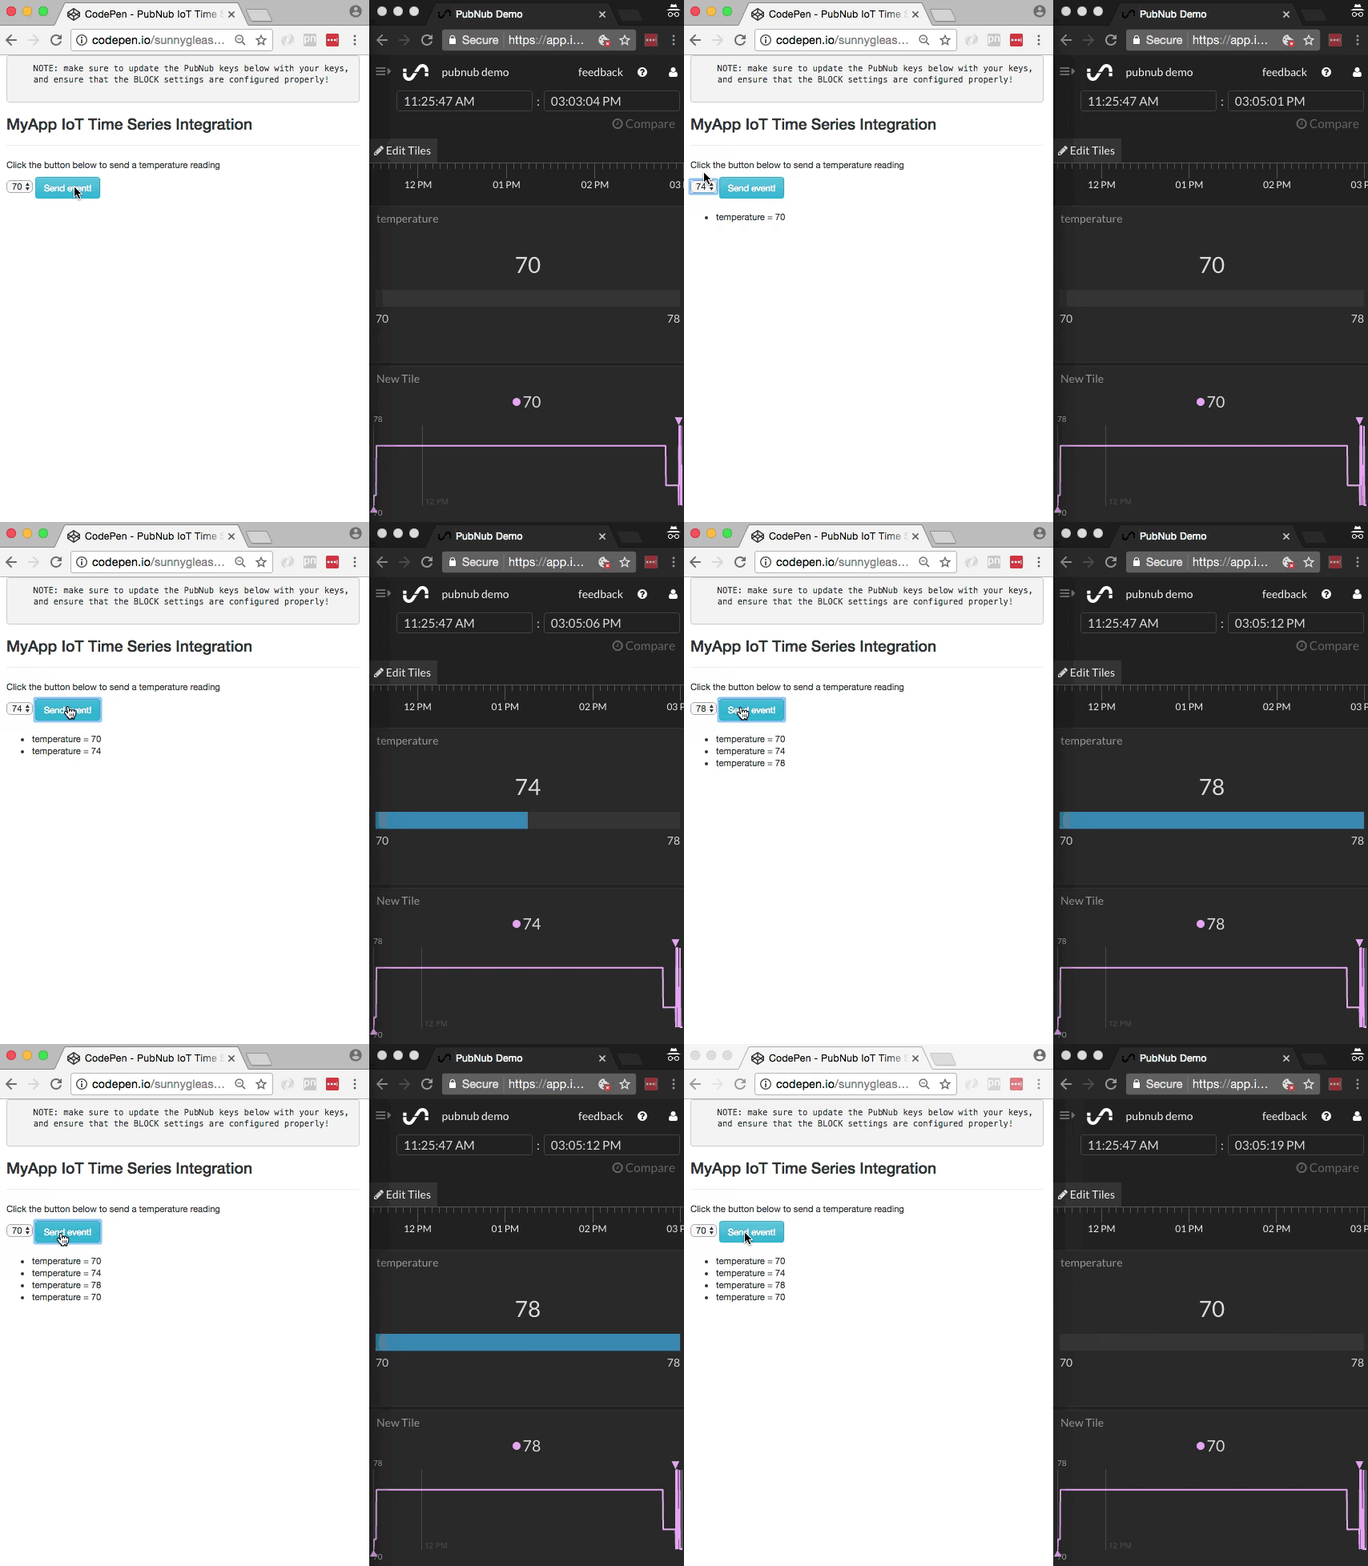
As we prepare to explore our sample Angular2 web application with IoT metrics visualization, let's check out the underlying Initial State Analytics API.
Initial State API for Real-time Dashboards
![]()
Large-scale monitoring and metrics analysis is a notoriously difficult area, and it requires substantial effort and engineering resources to maintain high availability and high efficiency in a metrics collection system.
Initial State provides a solution to these issues with a friendly UI and easy-to-use API that “just works.” Through the API and user interface, it is possible to track new metrics, create charts from simple and compound metrics, and organize charts into custom displays which can be embedded into any web site.
Obtaining your PubNub Developer Keys
You'll first need your PubNub publish/subscribe keys. If you haven't already, sign up for PubNub. Once you've done so, go to the PubNub Admin Portal to get your unique keys. The publish and subscribe keys look like UUIDs and start with “pub-c-” and “sub-c-” prefixes respectively. Keep those handy – you'll need to plug them in when initializing the PubNub object in your HTML5 app below.
About the PubNub JavaScript SDK
PubNub plays together really well with JavaScript because the PubNub JavaScript SDK is extremely robust and has been battle-tested over the years across a huge number of mobile and backend installations. The SDK is currently on its 4th major release, which features a number of improvements such as isomorphic JavaScript, new network components, unified message/presence/status notifiers, and much more.
NOTE: In this article, we use the PubNub Angular2 SDK, so our UI code can use the PubNub JavaScript v4 API syntax!
The PubNub JavaScript SDK is distributed via Bower or the PubNub CDN (for Web) and NPM (for Node), so it's easy to integrate with your application using the native mechanism for your platform. In our case, it's as easy as including the CDN link from a script tag.
That note about API versions bears repeating: the user interfaces in this series of articles use the v4 API (since they use the new Angular2 API, which runs on v4). In the meantime, please stay alert when jumping between different versions of JS code!
Getting Started with Initial State
The next thing you'll need to get started is an Initial State developer account.
- Go to the Initial State signup form.
- Go to the dashboard and create a new data bucket.
- Go to the data bucket settings and make note of the “bucket key” and “access key” (you'll need them shortly).
Overall, it's a pretty quick process. And free to get started, which is a bonus!
Setting up the Initial State BLOCK
Pubnub BLOCKS is our secret sauce. It'll allow us to connect our real-time data streams via PubNub to the Initial State service, no additional servers required.
- Go to the application instance on the PubNub Admin Portal.
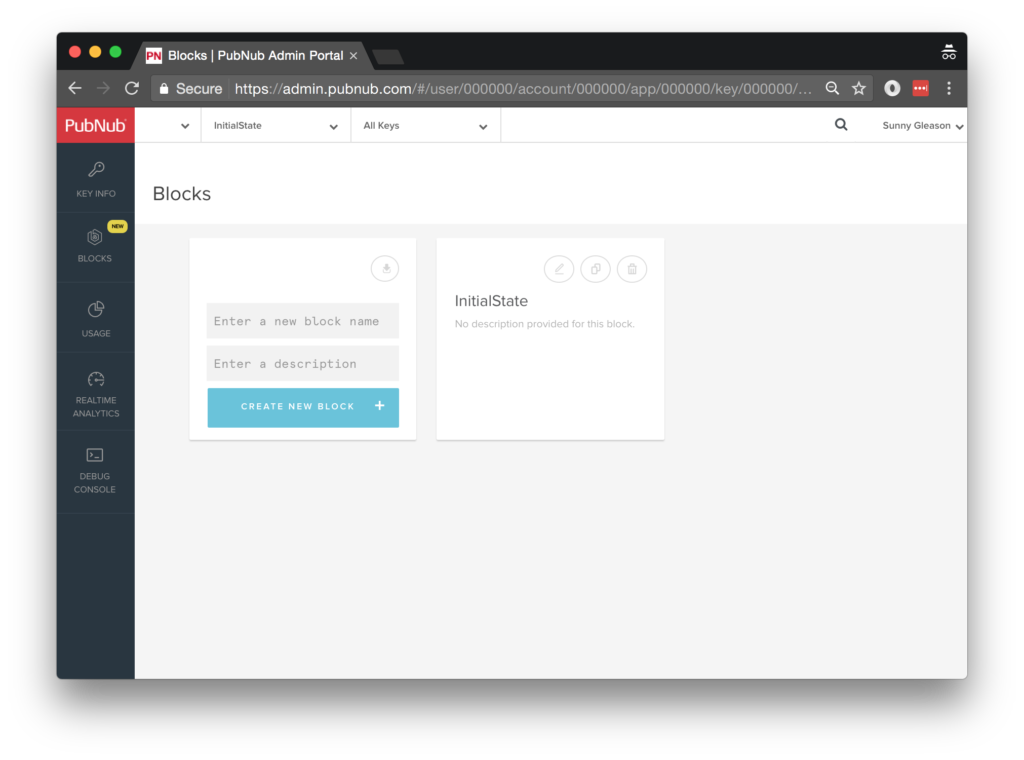
- Create a new BLOCK.
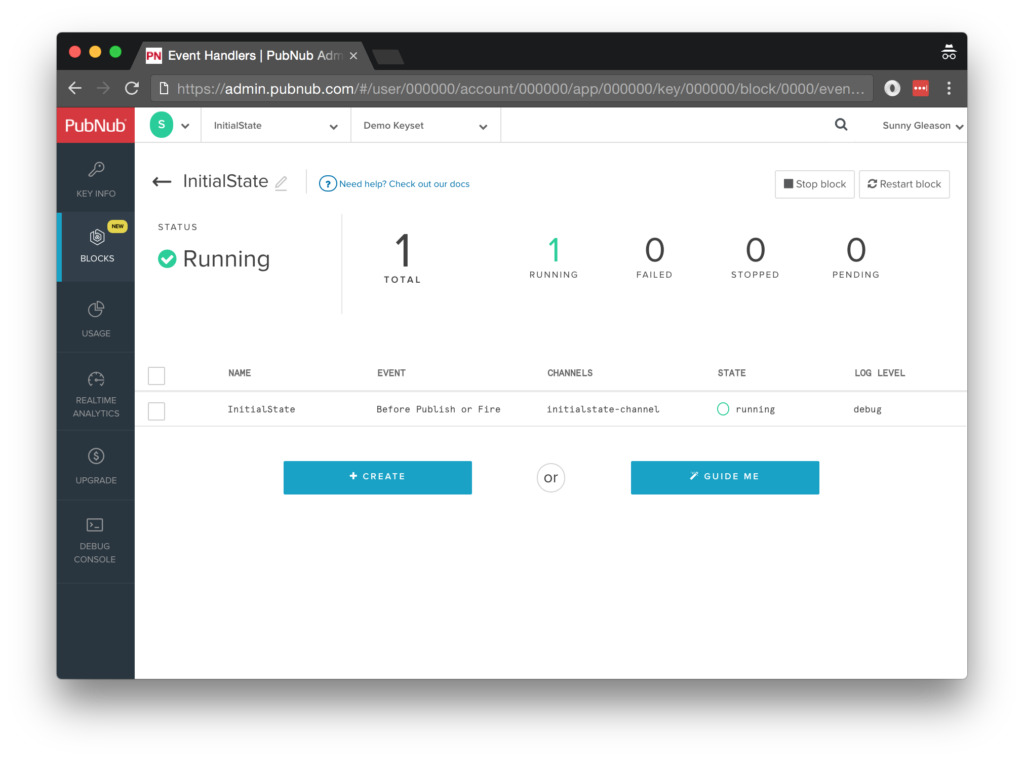
- Paste in the BLOCK code from the next section and update the credentials with the values from the previous steps above.
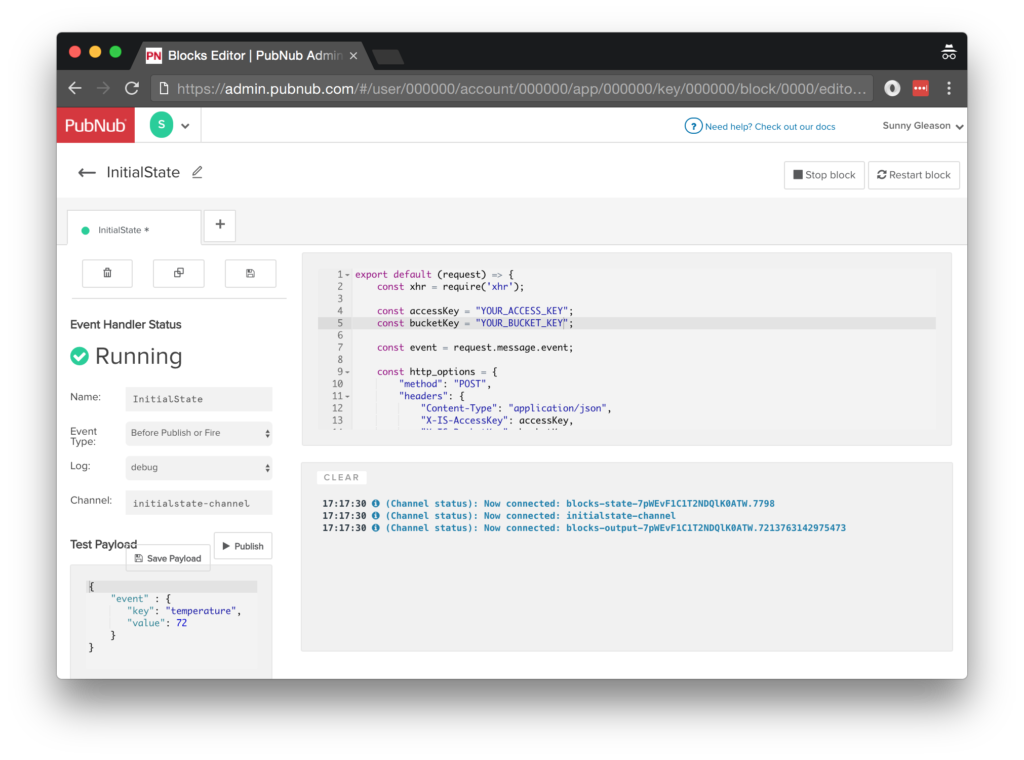
- Start the BLOCK, and test it using the “publish message” button and payload on the left-hand side of the screen.
Diving into the Code – the BLOCK
You'll want to grab the 26 lines of BLOCK JavaScript and save them to a file called pubnub_initialstate_block.js. It's available as a Gist on GitHub for your convenience.
First up, we declare our dependency on xhr (for HTTP requests) and create a function to handle incoming messages.
export default request => {
    let xhr = require('xhr');
Next, we set up variables for accessing the service (the API credentials and inbound event data).
    const accessKey = "YOUR_ACCESS_KEY";
    const bucketKey = "YOUR_BUCKET_KEY";
    const event = request.message.event;
Next, we set up the HTTP params for the Analytics API call. We use a POST request for the URL. We use the JSON content of the message as the source of most important parameters, and set the authentication headers.
    const http_options = {
        "method": "POST",
        "headers": {
            "Content-Type": "application/json",
            "X-IS-AccessKey": accessKey,
            "X-IS-BucketKey": bucketKey,
            "Accept-Version": "0.0.4"
        },
        body: JSON.stringify([event])
    };
Finally, we POST the given data and decorate the message with an is_result attribute containing the results of the API call. Pretty easy!
    const url = "https://groker.initialstate.com/api/events";

    return xhr.fetch(url, http_options).then((x) => {
        request.message.is_result = x;
        return request;
    });
}
All in all, it doesn't take a lot of code to add IoT metrics ingestion to our application. We like that! OK, let's move on to the UI.
Diving into the Code – the User Interface
You'll want to grab these 92 lines of HTML & JavaScript and save them to a file called pubnub_initialstate_ui.html.
The first thing you should do after saving the code is to replace two values in the JavaScript:
- YOUR_PUB_KEY: with the PubNub publish key mentioned above.
- YOUR_SUB_KEY: with the PubNub subscribe key mentioned above.
If you don't, the UI will not be able to communicate with anything and probably clutter your console log with entirely too many errors.
For your convenience, this code is also available as a Gist on GitHub, and a Codepen as well. Enjoy!
Dependencies
First up, we have the JavaScript code & CSS dependencies of our application.
<!DOCTYPE html>
<html>
  <head>
    <title>Angular 2</title>
    <script src="https://unpkg.com/core-js@2.4.1/client/shim.min.js"></script>
    <script src="https://unpkg.com/zone.js@0.7.2/dist/zone.js"></script>
    <script src="https://unpkg.com/reflect-metadata@0.1.9/Reflect.js"></script>
    <script src="https://unpkg.com/rxjs@5.0.1/bundles/Rx.js"></script>
    <script src="https://unpkg.com/@angular/core/bundles/core.umd.js"></script>
    <script src="https://unpkg.com/@angular/common/bundles/common.umd.js"></script>
    <script src="https://unpkg.com/@angular/compiler/bundles/compiler.umd.js"></script>
    <script src="https://unpkg.com/@angular/platform-browser/bundles/platform-browser.umd.js"></script>
    <script src="https://unpkg.com/@angular/forms/bundles/forms.umd.js"></script>
    <script src="https://unpkg.com/@angular/platform-browser-dynamic/bundles/platform-browser-dynamic.umd.js"></script>
    <script src="https://unpkg.com/pubnub@4.3.3/dist/web/pubnub.js"></script>
    <script src="https://unpkg.com/pubnub-angular2@1.0.0-beta.8/dist/pubnub-angular2.js"></script>
    <link rel="stylesheet" href="https://maxcdn.bootstrapcdn.com/bootstrap/3.3.7/css/bootstrap.min.css" />
    <link rel="stylesheet" href="https://maxcdn.bootstrapcdn.com/bootstrap/3.3.7/css/bootstrap-theme.min.css" />
  </head>
For folks who have done front-end implementation with Angular2 before, these should be the usual suspects:
- CoreJS ES6 Shim, Zone.JS, Metadata Reflection, and RxJS : Dependencies of Angular2.
- Angular2 : core, common, compiler, platform-browser, forms, and dynamic platform browser modules.
- PubNub JavaScript client: to connect to our data stream integration channel.
- PubNub Angular2 JavaScript client: provides PubNub services in Angular2 quite nicely indeed.
In addition, we bring in the CSS features:
- Bootstrap: in this app, we use it just for vanilla UI presentation.
Overall, we were pretty pleased that we could build a nifty UI with so few dependencies. And with that… on to the UI!
The User Interface
Here's what we intend the UI to look like (the right-hand browser window is an Initial State dashboard tiles view):
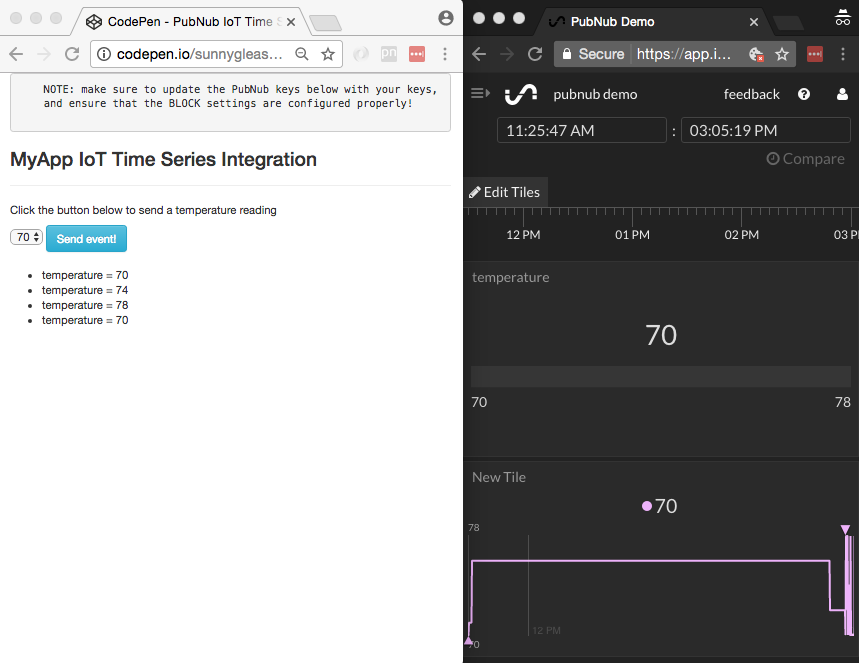
The UI is pretty straightforward – everything is inside a main-component tag that is managed by a single component that we'll set up in the Angular2 code.
<body>
  <main-component>
    Loading...
  </main-component>
Let's skip forward and show that Angular2 component template. We provide a select box with values and a simple button to perform the publish() action to send an event to be processed by the BLOCK.
<div class="container">
    <pre>
    NOTE: make sure to update the PubNub keys below with your keys,
    and ensure that the BLOCK settings are configured properly!
    </pre>
    <h3>MyApp IoT Time Series Integration</h3>
    <hr/>
    <p>Click the button below to send a temperature reading</p>
    <select [(ngModel)]="temperature">
      <option value="78">78</option>
      <option value="74">74</option>
      <option value="70">70</option>
    </select>
    <button class="btn btn-primary btn-info" (click)="publish()">Send event!</button>
    <br/>
    <br/>
    <ul>
      <li *ngFor="let item of messages.slice()">
        <div>{{item.message.event.key}} = {{item.message.event.value}}</div>
      </li>
    </ul>
</div>
The component UI consists of a simple list of events (in our case, the metrics events). We iterate over the messages in the component scope using a trusty ngFor. Each message includes the data from the Initial State API.
And that's it – a functioning real-time UI in just a handful of code (thanks, Angular2)!
The Angular2 Code
Right on! Now we're ready to dive into the Angular2 code. It's not a ton of JavaScript, so this should hopefully be pretty straightforward.
The first lines we encounter set up our application (with a necessary dependency on the PubNub AngularJS service) and a single component (which we dub main-component).
<script>
var app = window.app = {};
app.main_component = ng.core.Component({
    selector: 'main-component',
    template: `...see previous...`
The component has a constructor that takes care of initializing the PubNub service and configuring the channel name and initial value.
NOTE: make sure the channel matches the channel specified by your BLOCK configuration and the BLOCK itself!
    }).Class({
        constructor: [PubNubAngular, function(pubnubService){
            var self = this;
            self.pubnubService = pubnubService;
            self.channelName = 'initialstate-channel';
            self.temperature = "70";
Early on, we initialize the pubnubService with our credentials.
            pubnubService.init({
                publishKey:   'YOUR_PUB_KEY',
                subscribeKey: 'YOUR_SUB_KEY',
                ssl:true
            });
We subscribe to the relevant channel, create a dynamic attribute for the messages collection, and configure a blank event handler since the messages are presented unchanged from the incoming channel.
            pubnubService.subscribe({channels: [self.channelName], triggerEvents: true});
            self.messages = pubnubService.getMessage(this.channelName,function(msg){
              // no handler necessary, dynamic collection of msg objects
            });
        }],
We also create a publish() event handler that performs the action of publishing the new message to the PubNub channel.
        publish: function(){
            this.pubnubService.publish({channel: this.channelName, message:{event:{key:"temperature",value:this.temperature}}});
        }
    });
Now that we have a new component, we can create a main module for the Angular2 app that uses it. This is pretty standard boilerplate that configures dependencies on the Browser and Forms modules and the PubNubAngular service.
app.main_module = ng.core.NgModule({
    imports: [ng.platformBrowser.BrowserModule, ng.forms.FormsModule],
    declarations: [app.main_component],
    providers: [PubNubAngular],
    bootstrap: [app.main_component]
}).Class({
    constructor: function(){}
});
Finally, we bind the application bootstrap initialization to the browser DOM content loaded event.
document.addEventListener('DOMContentLoaded', function(){
    ng.platformBrowserDynamic.platformBrowserDynamic().bootstrapModule(app.main_module);
});
We mustn't forget close out the HTML tags accordingly.
});
</script>
</body>
</html>
With that, we're now visualizing our IoT data via Initial State. Not too shabby for about 92 lines of HTML & JavaScript!
Additional Features
There are a couple other features worth mentioning in the Initial State product. You can find detailed API documentation Clicking here and overview docs Clicking here.
- Tiles : dashboards with customized data display.
- Waves : multi-row metrics waveform analysis with useful statistics.
- Lines : interactive, stacked line viewer for time series comparison.
All in all, we found it pretty easy to get started with custom metrics using the API, and we look forward to using more of the deeper integration features!
Conclusion
Thank you so much for joining us in the IoT metrics article of our BLOCKS and web services series! Hopefully it's been a useful experience learning about IoT metrics visualization technologies. In future articles, we'll dive deeper into additional web service APIs and use cases for other nifty services in real time web applications.
Stay tuned, and please reach out anytime if you feel especially inspired or need any help!