PubNub Real-time Gateway for Microsoft Azure EventHub
In our last tutorial, we walked you through easily creating real-time charts with PubNub and Microsoft Power BI by way of Power BI’s Streaming Datasets interface. This method of connecting Power BI to PubNub is useful when you are looking for a quick and easy way to chart data directly from a PubNub data stream.
However, there are cases when users may wish to take real-time data from a PubNub data stream, manipulate or store it using Azure Cloud Services, such as Azure Stream Analytics, and then chart that new [mutated] data stream in real time. For this latter use case, we now have a simple way to accomplish it: The PubNub Real-time Gateway for Microsoft Azure.
PubNub/Microsoft Architectures
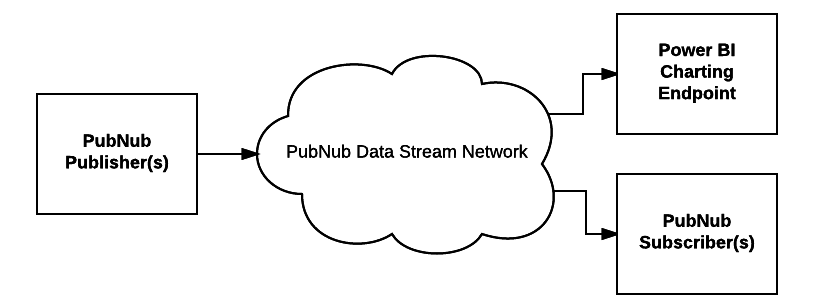
Our previous solution addressed the use case of simply utilizing PubNub and Power BI components to chart data with no defined intermediary; PubNub was the real-time data stream source, and Power BI was used as the client, or direct subscribing endpoint, to chart that data in real time:
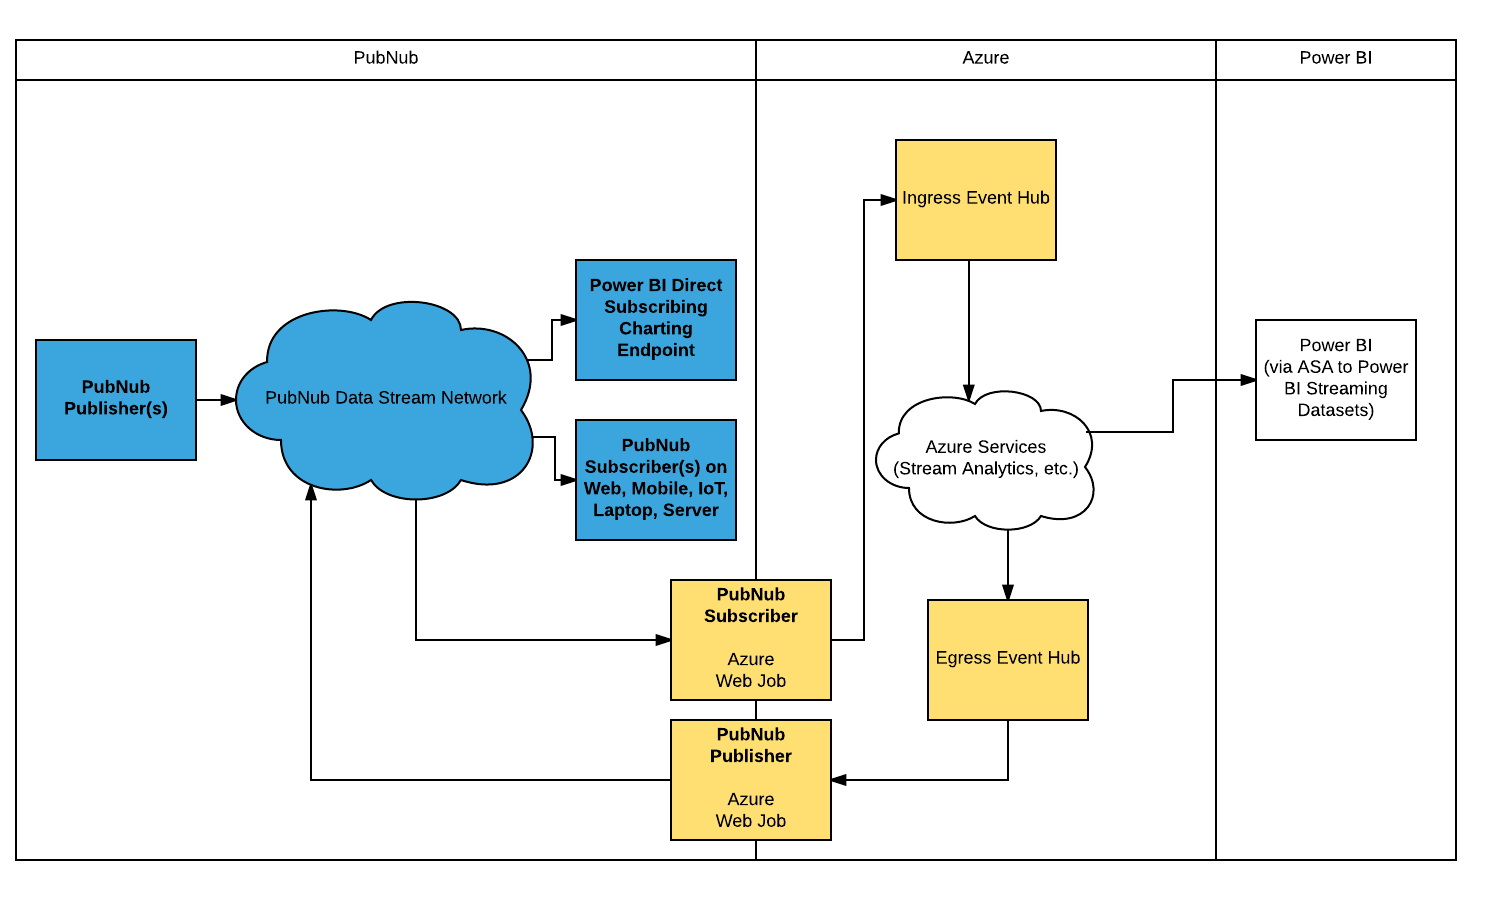
In our newest use case, the solution introduces some intermediaries into the equation; namely Azure WebJobs, Event Hubs and Stream Analytics:

Use Case Limits
The ARM template and use case discussed in this tutorial serve to provide a “general purpose” PubNub <-> Azure bridging architecture. The ARM template defines a Basic 1: Small service plan, with a 1 Throughput Unit Event Hub configuration.
It's an economical setup that is great to explore Azure and PubNub with, but definitely not a one-size-fits all for production. The default configuration should be able to handle one Megabyte per second OR one thousand messages per second; however, there are many factors which may increase or decrease these default limits based on your specific traffic patterns, Azure service plan, use case, and overall system complexity.
For this reason, if you plan to implement this bridge for an enterprise / production environment, please contact us at support@pubnub.com so we may review your particular use case and assist with any fine tuning necessary on the PubNub and/or Microsoft side. With proper architectural review, the PubNub and Microsoft components can be scaled to handle and process as much load as your use case demands.
Component Overview
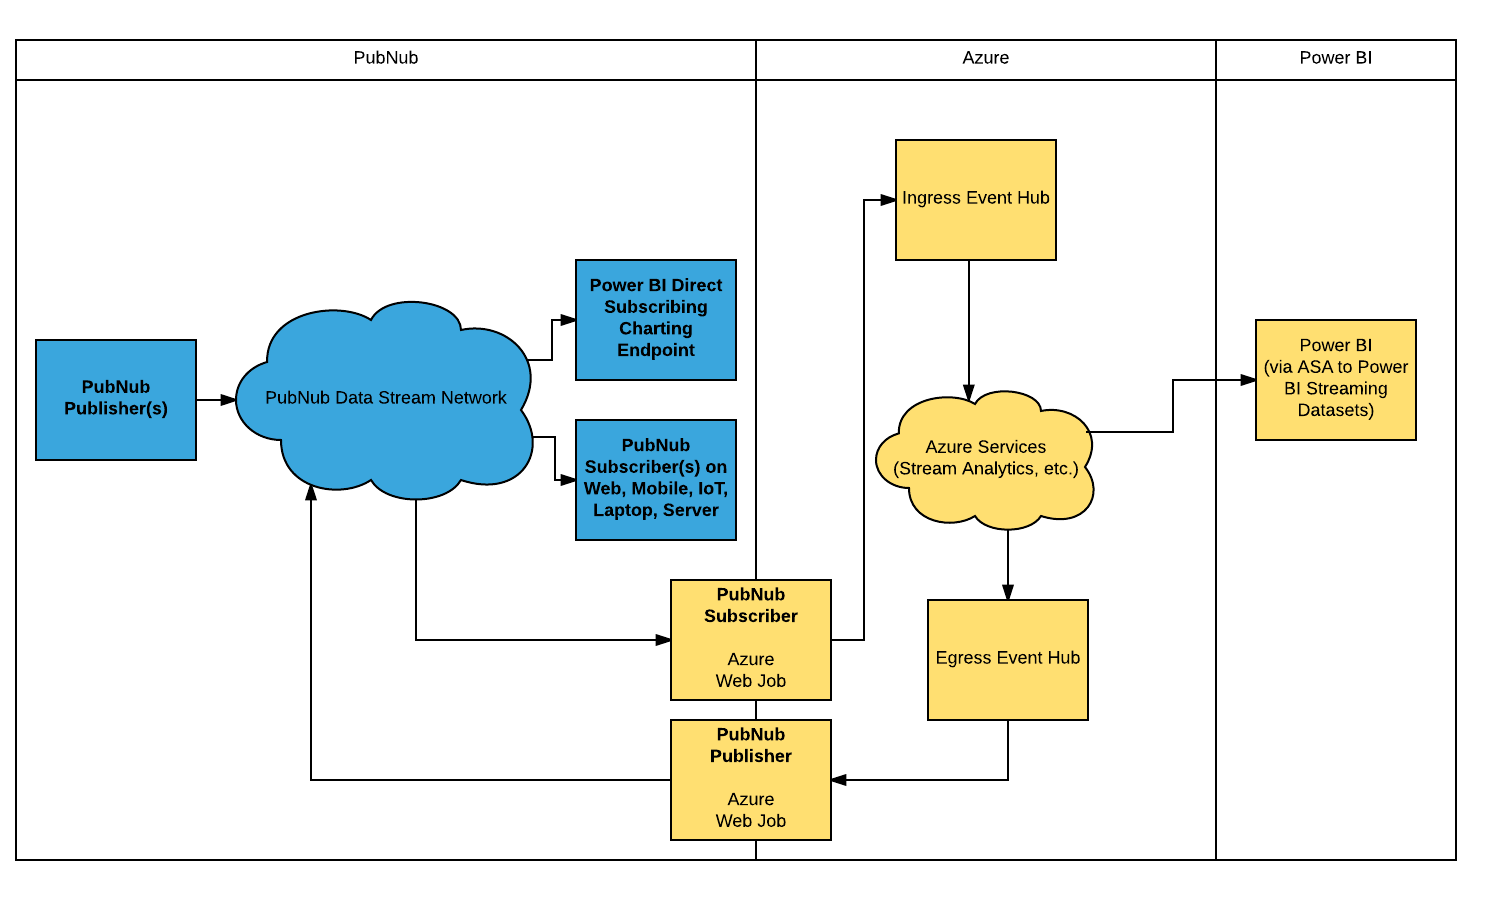
To quickly describe the job function of each of these components (reading the above diagram from left to right, top to down):
- PubNub Publishers publish real-time data streams onto PubNub, for example, an array of sensors broadcasting temperature, noise, and humidity measurements.
- PubNub Subscribers consume these real-time data streams. Examples of PubNub Subscribers may include mobile devices running an environmental monitoring app that is receiving the published PubNub real-time environmental sensor data, or even the previously discussed Power BI Subscriber endpoint implementation.
- As we approach the PubNub / Azure System Boundary, we have a PubNub Subscriber running on an Azure WebJob, receiving PubNub real-time data streams, and forwarding that data in real time to the Azure Ingress Event Hub.
- The Ingress Event Hub then serves as an “Input” to any Azure Cloud service of your choice — in this example, Azure Stream Analytics.
- Azure Stream Analytics performs operations on the data, and sends the results out in real time through the Azure Egress Event Hub.
- The Egress Event Hub forks this new, “calculated” (via Azure Stream Analytics) real-time data stream back out to the PubNub Publisher running on an Azure WebJob, forwarding back to PubNub, enabling any authorized PubNub subscribers on the Internet to ingest this newly provisioned datastream.
- Via Stream Analytics, we can also fork this mutated dataset out directly to Power BI using the new ASA to Power BI Streaming Datasets feature, enabling Power BI to chart this newly calculated data stream without the need for any additional dataset import steps on the Power BI side.
Building the System
It should be evident from the description so far that we’re dealing with a fair number of technologies. However, the good news is that 95% of the installation and configuration can be done with a few clicks of the mouse using the new PubNub Real-time Gateway for Azure Event Hubs ARM Template!
The PubNub Real-time Gateway for Azure Event Hubs ARM Template is a Microsoft Azure ARM template which expedites creation of the WebJob, PubNub/Azure Node.js Gateway Script, and Event Hubs. Using it, we’ll deploy the bulk of the system in just minutes.
With that in mind, the only manual setup and configuration will be that of the Power BI charting and Azure Stream Analytics components… the good news is that although they require a few more manual steps, they are still very easy to setup — you can expect the time required to stand the whole system up, end-to-end, to take about 30 minutes!
The Sample Sensor-network Data Stream
If you choose to use the provided sample sensor-network data stream (recommended for first time users), the following summarizes the [fictional] story and [not so fictional] composition of that data stream:
Connected Cities Inc. is in the business of enabling smart city functionality to cities around the globe. Running on the publicly available mspowerbi publish and subscribe keys, on channel sensor-network, their real-time data stream currently contains real-time environmental data from five different cities, each with attributes of:
- Location / Geo (keyed by name, with lat/lon object data)
- Temperature (in both F and C)
- Humidity (%)
- Barometric Pressure (mb)
- Pollution Index
- UV Index
- Noise Level (dB)
The JSON data stream will look similar to this snippet:
{
   "timestamp": "2016-08-23T22:31:40.255Z",
   "Novato": {
       "geo": "38.1074° N, 122.5697° W",
       "temperature": {
           "F": "99.9",
           "C": "37.7"
       },
       "humidity": "40.965",
       "barometric": "1011.8",
       "pollution": 3,
       "uv": 9.5,
       "noise": "28.75962"
   },
   "Redmond": {
       "geo": "47.6740° N, 122.1215° W",
      ...
   }
}
The Prerequisites
Before we begin, it's important to have a few things setup:
- Create a PubNub Data Stream Account.
- Create a Microsoft Azure Account.
- Create a Microsoft Power BI Account.
- Clone the Azure Quickstart Templates Repository.
- Install Node.js and npm.
PubNub Data Stream Account
The PubNub Real-time Gateway for Azure can handle any PubNub real-time data stream, as long as the payload is in the format of JSON object (flat, or with hierarchy.)
Some “demo” API keys are available to get you off the ground quickly. When you’re ready to use your own PubNub data streams and you don’t yet have an account, go ahead and sign up for your PubNub account. Create an App, and then a Keyset, and you’ll be ready to go.
Our tutorial will utilize a demo data stream called “sensor-network.” It runs under the “mspowerbi” PubNub API keys on the “sensor-network” channel.
Microsoft Azure Account
Being an Azure-centric implementation, you’ll naturally need to create an account on MS Azure. Head on over to Azure to setup an account. The Pay-As-You-Go account is suggested for this tutorial.
Microsoft Power BI Account
If you don’t already have a Power BI account, follow these steps:
- Browse to https://powerbi.microsoft.com/en-us/ to get to the Power BI homepage.
- Click Get started free.
- Click Sign Up under Power BI (Not Power BI Desktop for Windows).
NOTE: Some Azure services rely on all participating Azure components being located in the same region. The way the ARM template is currently coded, it's required to use West US for all location variables. If this is showstopping for you, please fork the repo, and edit any hardcoded “West US” values in the template to the locations you desire, and then be sure the form values match when deploying.
Clone the Azure Quickstart Templates Repository
To gain access to some useful development and troubleshooting tools, clone the last commit of the Azure Quickstart Templates repository.
Change to the directory you wish to clone into, and run the command:
git clone --depth=1 https://github.com/Azure/azure-quickstart-templates
git checkout marketplace
Install Node.js and npm
Follow the directions here to install Node.js and npm: https://docs.npmjs.com/downloading-and-installing-node-js-and-npm
Once the prerequisites are complete, we’re ready to begin with the first step of provisioning the PubNub Real-time Gateway for Azure: deployment of the Azure components.
Phase 1: Deploying the PubNub Gateway using the Quickstart Template
In the diagram below, the items in blue are the components that are already in existence, and the items in white are the ones that still need to be created.
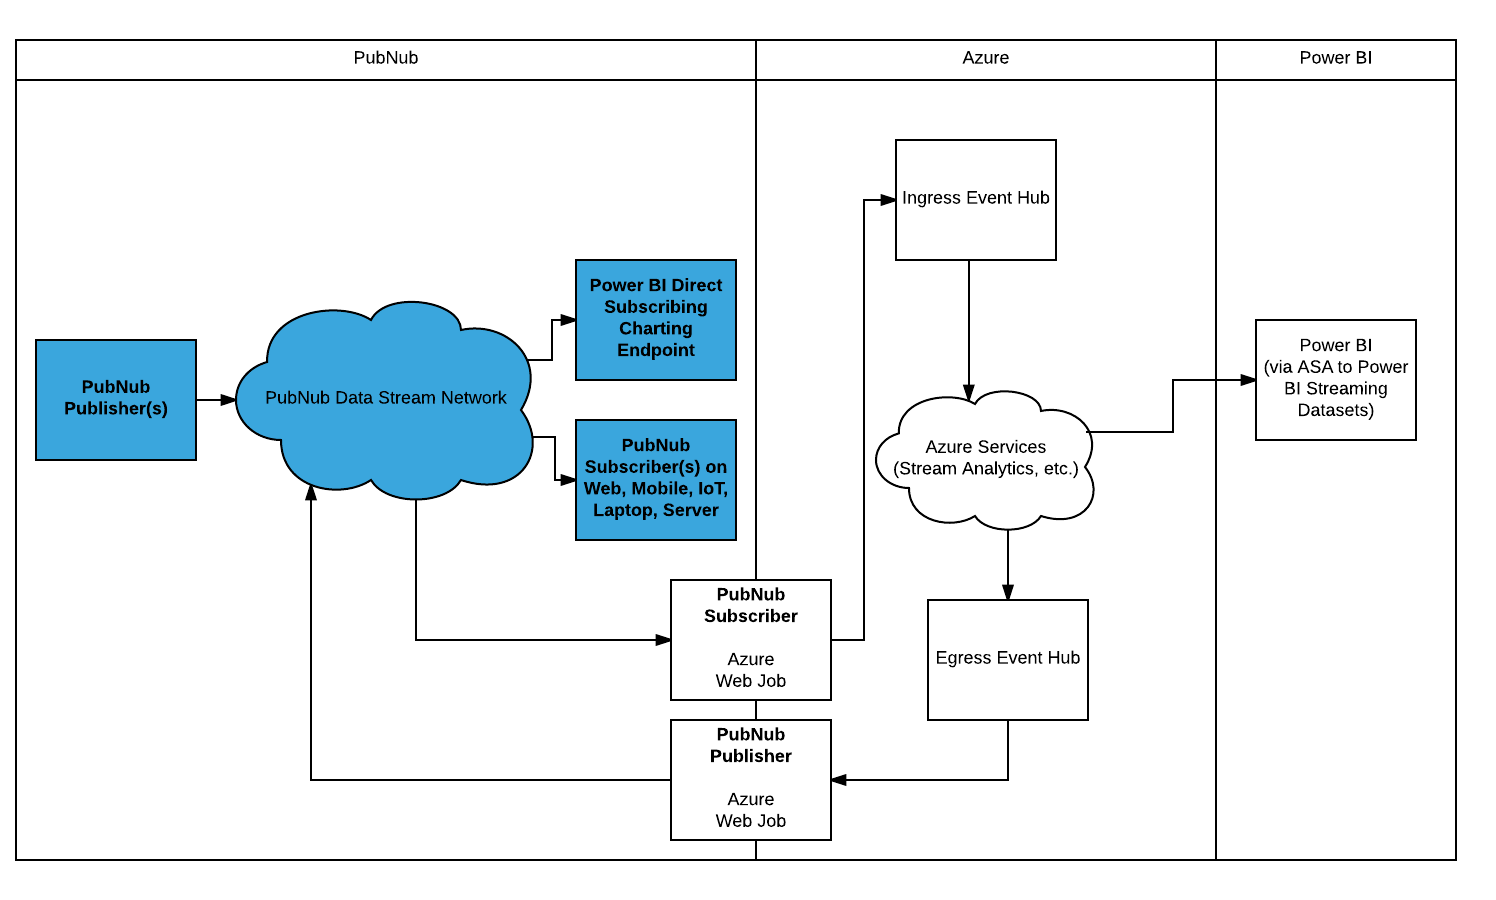
In Phase 1 of the tutorial, we’ll be deploying the Event Hubs, and the WebJobs running the PubNub Publish/Subscribe bridge.
The old way to do this would be to manually provision, and then manually configure and connect them to each other. Even for a pro, this could take a bit of time, and due to pesky human nature, it would be very error prone.
Microsoft, in partnership with PubNub, has made this process incredibly simple by providing an ARM Template that does this heavy lifting for you!
To access this template:
- Navigate to the Azure Quickstart Templates page available at https://azure.microsoft.com/en-us/resources/templates/.
- In the Search Field, enter pubnub and click Search.
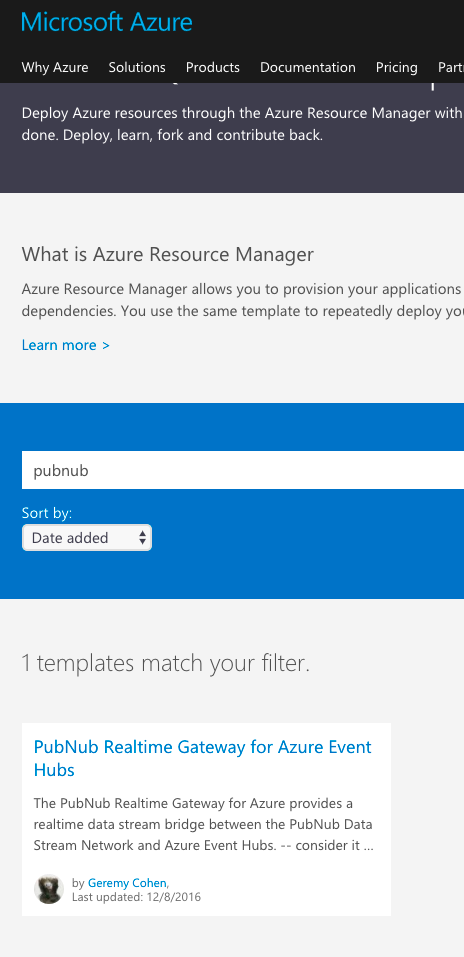
This will take you to the landing page for PubNub Real-time Gateway for Azure Event Hubs.
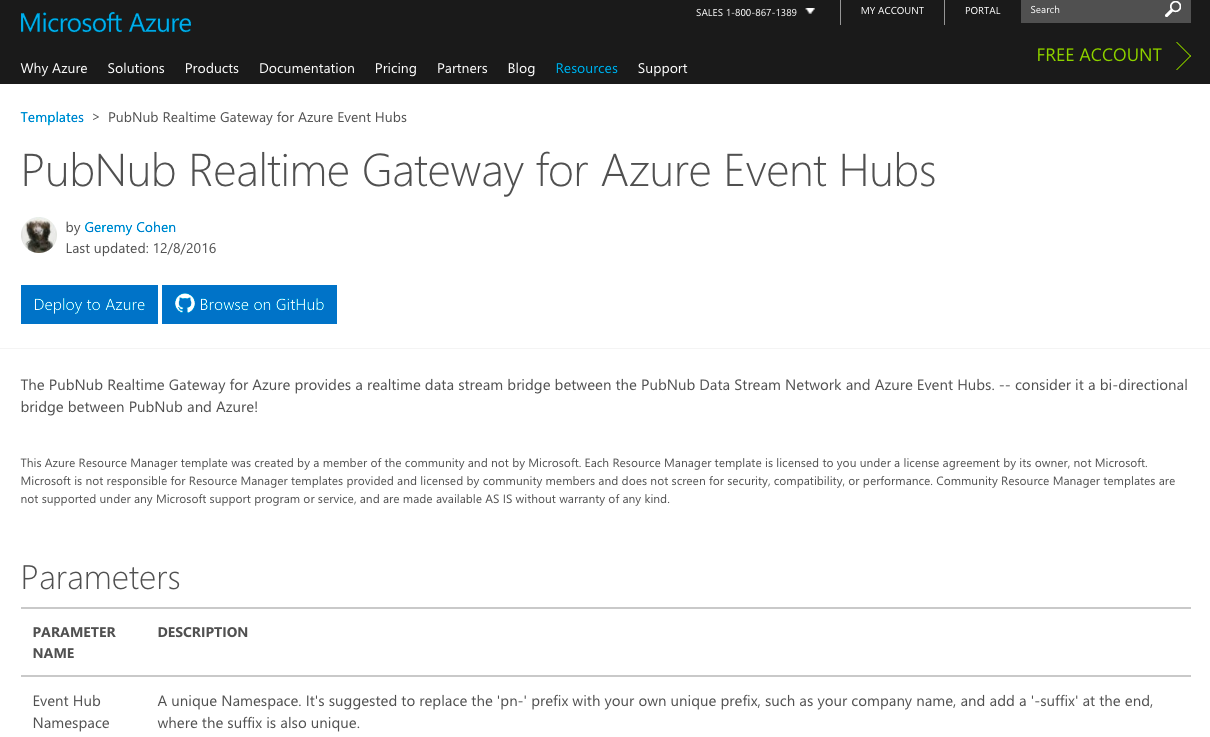
From here, it's highly suggested to click the Browse on GitHub link, and inspect the README.
This will provide you with a wealth of information on the details of how all the moving parts interface together. After you’ve read the README (or if you’re just really eager to test it out) you’ll want to begin the actual deployment process by clicking the Deploy to Azure link.
Entering the ARM Template Parameters
After you click on the Deploy to Azure link, if you are already logged in Azure, the template will appear from within the Azure Portal. If you aren’t logged in to Azure, it will first redirect you to the login screen for Azure, and after successful login, should redirect you to the ARM Template.
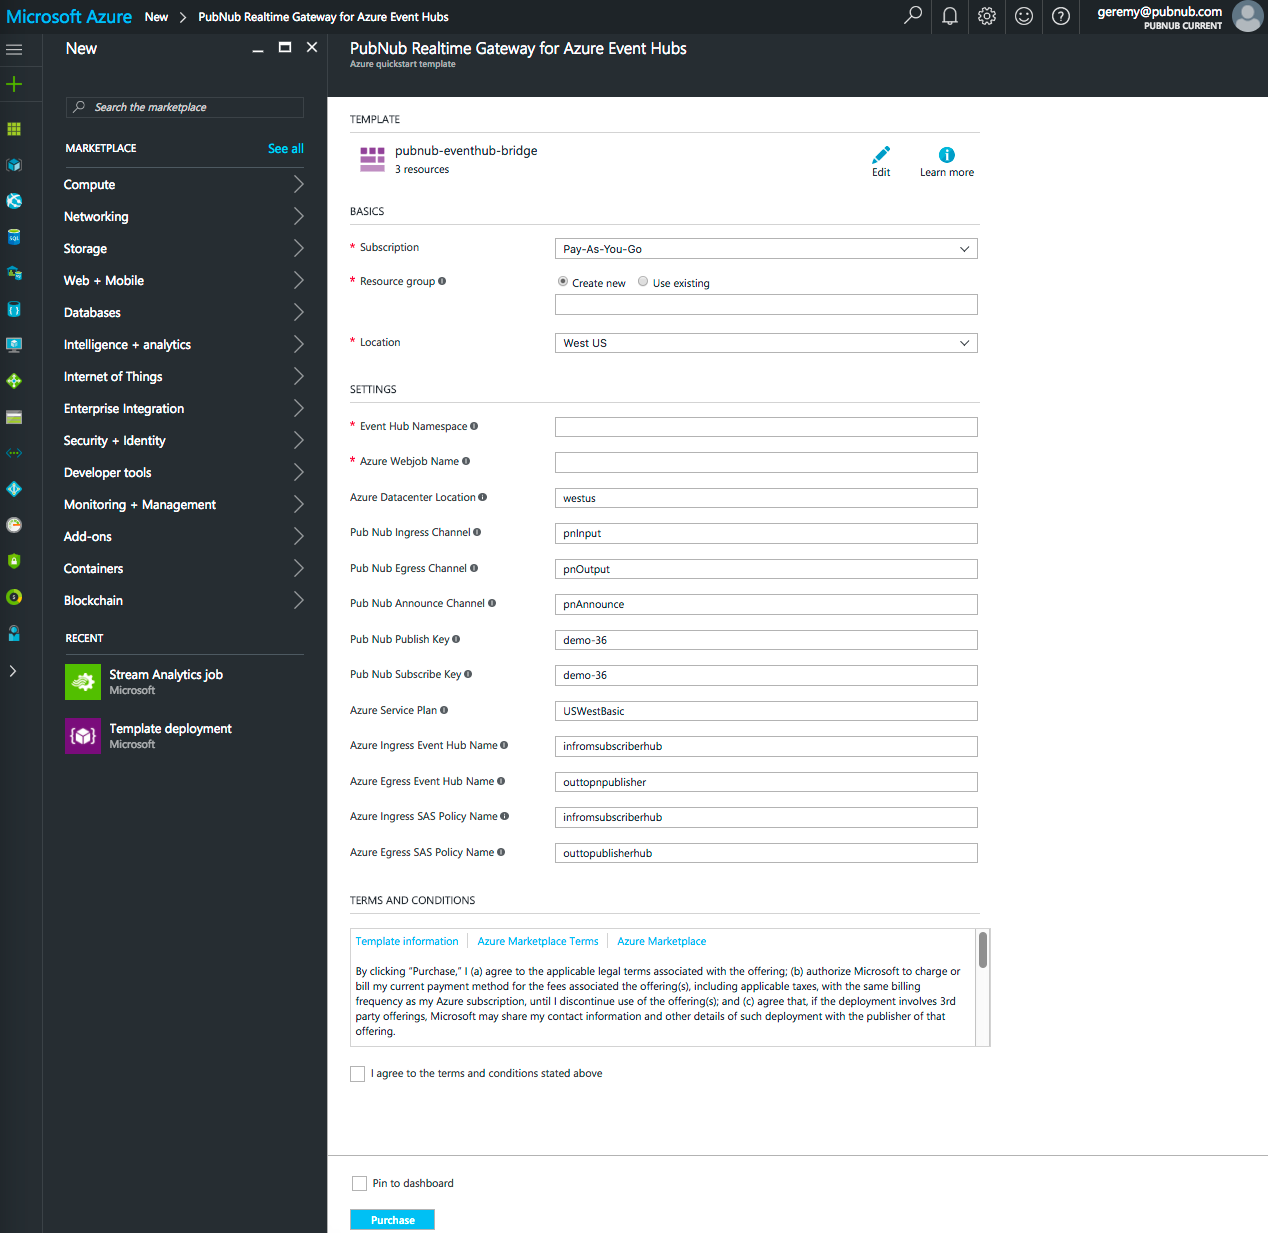
When the ARM Template appears, you will see a form with some defaults as well as some blank fields.
Any field with a default value can be considered “sane” for development, and left at default values. Any blank fields will require you to enter a unique, legal value manually.
Let's go over each field in detail… once you understand each field in detail, there will be less mystique about the components involved, and how they interact together.
- Choose the Subscription you wish to associate this deployment with. For my setup, it is Pay-As-You-Go.
- Create a new, or use an existing Resource Group to deploy this template to. In our example, we’ll create a new one called pnms1.
NOTE: It's suggested to use a unique Resource Group if it's your first time playing with this template… that way if you need to experiment with different configurations, deleting the entire Resource Group is a quick way to delete all the components so you can start over from the beginning with a clean slate.
- For Location, select West US.
NOTE: Some Azure services rely on all participating Azure components being located in the same region. The way this template is currently coded, it's required to use West US for all location variables. If this is showstopping for you, please fork the repo, and edit any hardcoded “West US” values in the template to the locations you desire, and then be sure the form values match when deploying.
- For the Event Hub Namespace, create a unique Namespace.
An easy way to create a unique namespace is to use the following format:
COMPANY DOMAIN NAME (with no period character) – eventhub – DATE – TIME
For example, if your company was widgets.com, you could name it something unique like:
widgetscom-eventhub-012217-1252
You don't need to follow this exact pattern, but be sure it's unique! You won’t know there was a namespace collision until after the script runs (and fails), so be sure to make this as unique as possible the first time around!
Also, use dashes as string separators, or refer to Azure documentation for the list of legal chars in an Event Hub Namespace string.
- For the Azure Web Job Name, create a unique Web Job Name. Follow the same naming conventions as for Event Hub Namespaces to ensure you have a unique, legal string.
In our example, create a unique Azure Web Job name by following the same naming conventions as for Event Hub Namespaces (in step 4) to ensure you have a unique, legal string.
NOTE: It is important to create a unique name here to prevent a name collision with other users.
- For the Azure Datacenter Location, enter westus.
NOTE: Some Azure services rely on all participating Azure components being located in the same region. The way this template is currently coded, it's required to use West US for all location variables. If this is showstopping for you, please fork the repo, and edit any hardcoded “West US” values in the template to the locations you desire, and then be sure the form values match when deploying.
- For the PubNub Ingress Channel, enter a channel name that the PubNub Subscriber should listen on. In our example, we’ll use sensor-network.
NOTE: sensor-network is the public, shared input channel all users of this tutorial will use to feed into the Azure system from PubNub.
- For the PubNub Egress Channel, enter a channel name that the PubNub Publisher shall publish back out on.
In our example, create a unique PubNub Egress Channel name by following the same naming conventions as for Event Hub Namespaces (in step 4) to ensure you have a unique, legal string.
NOTE: It is important to create a unique name here to prevent a name collision with other users.
- For the PubNub Announce Channel, enter a channel name that the PubNub Deployment script will alert on when the deployment has completed.
In our example, create a unique PubNub Announce Channel name by following the same naming conventions as for Event Hub Namespaces (in step 4) to ensure you have a unique, legal string.
NOTE: It is important to create a unique name here to prevent a name collision with other users. And if you don't intend on using the Announce feature in the now or in the future, this value can be set to all-lowercase disabled.
- For the PubNub Publish Key, enter the PubNub Publish API Key that the PubNub component should publish against. In our example, we’ll use mspowerbi.
- For the PubNub Subscribe Key, enter the PubNub Subscribe API Key that the PubNub component should subscribe against. In our example, we’ll use mspowerbi.
- For the Azure Service Plan, enter USWestBasic.
NOTE: Some Azure services rely on all participating Azure components being located in the same region. The way this template is currently coded, it's required to use West US for all location variables. If this is showstopping for you, please fork the repo, and edit any hardcoded “West US” values in the template to the locations you desire, and then be sure the form values match when deploying.
- For the Azure Ingress Event Hub Name, enter the name you wish to give the Ingress (Input) Event Hub. You can accept the default, as the Event Hub name needs only to be unique within a unique Event Hub Namespace. In our example, we’ll use the default, infromsubscriberhub.
- For the Azure Egress Event Hub Name, enter the name you wish to give the Egress (Output) Event Hub. You can accept the default, as the Event Hub name needs only to be unique within a unique Event Hub Namespace. In our example, we’ll use the default, outtopnpublisher.
- For the Azure Ingress SAS Policy Name, enter the name you wish to give the Ingress (Input) Event Hub SAS Policy. You can accept the default, as the Event Hub SAS Policy name needs only to be unique within a unique Event Hub Namespace.In our example, we’ll use the default, infromsubscriberhub.
- For the Azure Egress SAS Policy Name, enter the name you wish to give the Egress (Output) Event Hub SAS Policy. You can accept the default, as the Event Hub SAS Policy name needs only to be unique within a unique Event Hub Namespace. In our example, we’ll use the default, outtopnpublisher.
- Check the I agree to the terms and conditions stated above checkbox.
But don’t click the Purchase button yet! There is one more step to take before we provision the Azure components — and that is to use the provisioningListener.js script to monitor the progress of the deploy before we proceed.
Setting up the Provisioning Monitor Script
NOTE: Before following this step, make sure you installed Node.js and cloned the Azure Quickstart Repository as detailed in the Prerequisites section.
Before we begin the deployment on the Azure-side, we’ll setup a utility to monitor the progress of our Azure components install in real time. This utility is called provisioningListener.js, and it's located in our template’s tools subdirectory. To run it:
- Change directory to the cloned repo’s pubnub-eventhub-bridge directory
- Change directory to tools
- Run
npm install - After npm install completes running, run the provisioning listener in provision mode (replacing the announce channel name with the same channel name you entered in the Azure Quickstart Template):
node provisioningListener.js provision pubnubcom-announce-0122217-1252 mspowerbi
In the above command line:
- provision – This is the mode to run in. Options are provision or monitor.
- pubnubcom-announce-0122217-1252 – This is the unique PubNub Announce Channel value, same as what you entered in the Azure Quickstart Template.
- mspowerbi – This is the PubNub Subscribe Key of the PubNub data stream, same as what you entered in the Azure Quickstart Template.
When you press enter, you should see something similar to:
$ node provisioningListener.js provision pubnubcom-announce-0122217-1252 mspowerbi
provision mode detected.
Subscribe Key: mspowerbi
Announce Channel: pubnubcom-announce-0122217-1252
Setting UUID to provisioning-142.46923779137433
Listening for new PN/Azure Web Job Announce...
NOTE: Be sure to set your terminal application to either very high or infinite scroll size, at least for the first few times you play with this tutorial. There will be a lot of data coming through, and you may want to be able to scroll through the history at some point.
Now that we have the monitoring script running, we’ll return to the Azure Quickstart Template to begin the deployment process on the Azure-side.
Completing the Quickstart Template Deployment
Returning to the Azure Quickstart Template, please verify that your template looks similar to the following, making sure that the Event Hub Namespace, Azure WebJob Name, PubNub Egress and Ingress Channel Names are completely unique per your implementation:
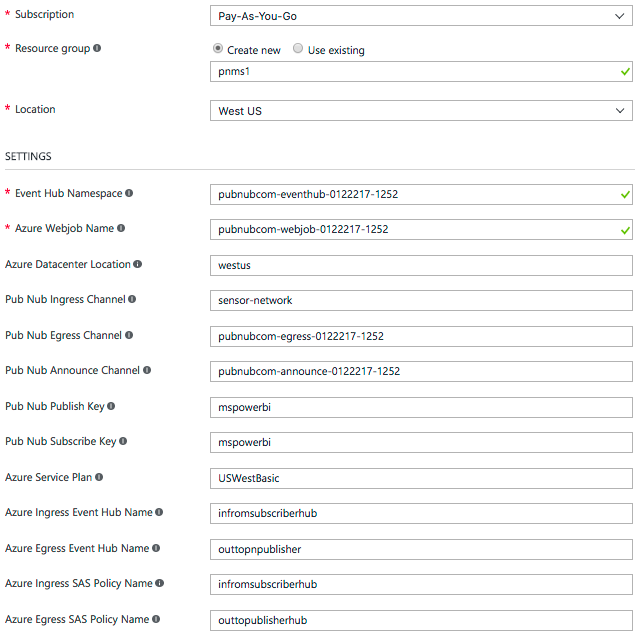
- Click Purchase.
The deployment has begun!
Monitoring the Deployment
If you click on the notifications menu item in the Azure Dashboard screen, you should see an indication that the deployment has started.
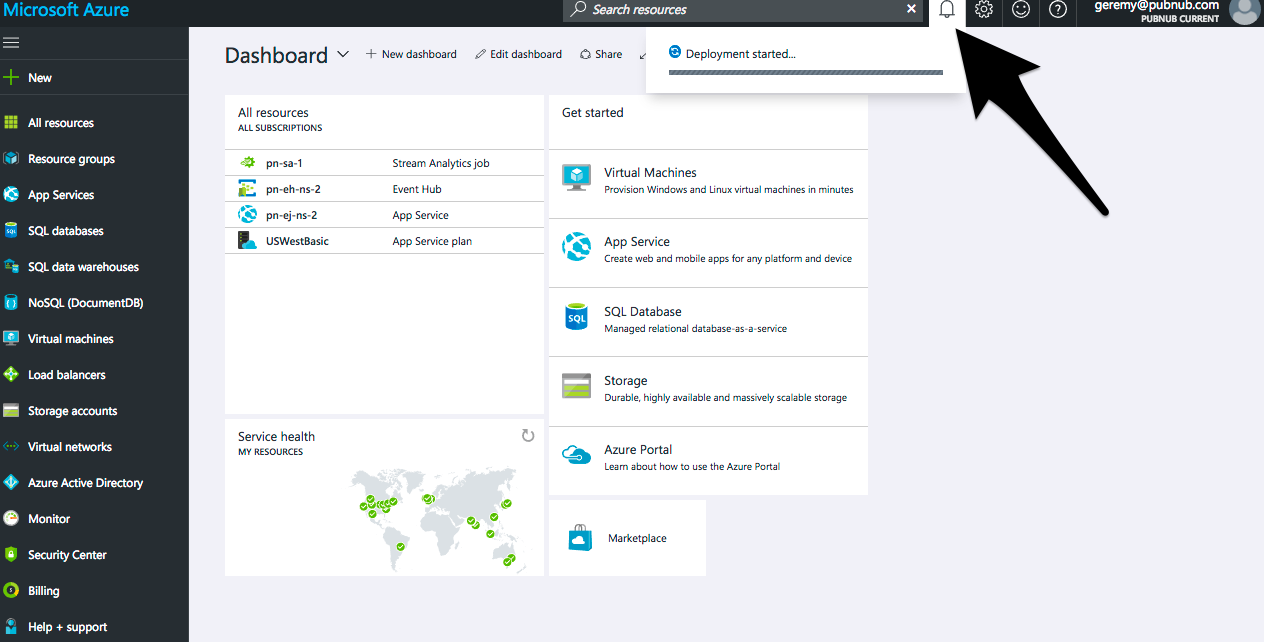
In addition to the notifications menu item in the Azure Dashboard, we also have our provisioningListener.js script running from earlier.
The provisioningListener.js script is using the PubNub to Azure Event Hub bridge to retrieve connection string information from the deployment.
Once this connection string information is received, the script connects natively (via AMQP) to the Event Hubs via the Azure Event Hub libraries.
Once Azure completes the deployment, it will yield additional debug information, such as the output of the PubNub real-time data stream feeding into Azure (in our case, the sensor-network channel, via the Ingress Event Hub), as well as any output data we send back out, via the Egress Event Hub (but you won’t see that until Phase 2):
$ node provisioningListener.js provision pubnubcom-announce-0122217-1252 mspowerbi
provision mode detected.
Subscribe Key: mspowerbi
Announce Channel: pubnubcom-announce-0122217-1252
Setting UUID to provisioning-142.46923779137433
Listening for new PN/Azure Web Job Announce...
Received auto-provisioning payload from webjob-339.3171068198657
In the future, use the below command to monitor these Event Hubs:
node provisioningListener.js
monitor"Endpoint=sb://pubnubcom-eventhub-0122217-1252.servicebus.windows.net/;SharedAccessKeyName=infromsubscriberhub;SharedAccessKey=uF1Oo0YdGJaA8tniYQ8YQrjACoK/Mc/xqIlmLTRfexk=;EntityPath=infromsubscriberhub" "Endpoint=sb://pubnubcom-eventhub-0122217-1252.servicebus.windows.net/;SharedAccessKeyName=outtopublisherhub;SharedAccessKey=7hQgoU4nLoxMFrpu+1UMljjNDxRVGJvIZwPmx0GLK6w=;EntityPath=outtopnpublisher"
Ingress Event Hub Connection String:
Endpoint=sb://pubnubcom-eventhub-0122217-1252.servicebus.windows.net/;SharedAccessKeyName=infromsubscriberhub;SharedAccessKey=uF1Oo0YdGJaA8tniYQ8YQrjACoK/Mc/xqIlmLTRfexk=;EntityPath=infromsubscriberhub
Egress Event Hub Connection String:
Endpoint=sb://pubnubcom-eventhub-0122217-1252.servicebus.windows.net/;SharedAccessKeyName=outtopublisherhub;SharedAccessKey=7hQgoU4nLoxMFrpu+1UMljjNDxRVGJvIZwPmx0GLK6w=;EntityPath=outtopnpublisher
Waiting for messages to arrive via Event Hubs...
Message Received on Ingress Event Hub:   : {"timestamp":"2017-01-23T23:30:30.996Z","Novato":{"geo":"38.1074° N, 122.5697° W","temperature":{"F":"99.9","C":"37.7"},"humidity":"40.907","barometric":"1011.4","pollution":3,"uv":9.5,"noise":"29.26508"},"Redmond":{"geo":"47.6740° N, 122.1215° W","temperature":{"F":"75.9","C":"24.4"},"humidity":"60.918","barometric":"1011.3","pollution":6,"uv":5.7,"noise":"38.94057"},"San Francisco":{"geo":"37.7749° N, 122.4194°
...
More Information the Provisioning Monitor Script Output
Let's quickly deep-dive into the output of our monitor script:
Listening for new PN/Azure Web Job Announce...
Received auto-provisioning payload from webjob-339.3171068198657
When we initially ran the script, we gave it a PubNub API key and channel to listen for “announcement” messages.
The above message confirms an auto-provisioning payload was received by the script while listening for “announcement” messages.
This is the only indication we need that the deployment has succeeded, however, as we read on, we can find other useful information in this script’s output.
In the future, use the below command to monitor these Event Hubs:
node provisioningListener.js monitor
"Endpoint=sb://pubnubcom-eventhub-0122217-1252.servicebus.windows.net/;SharedAccessKeyName=infromsubscriberhub;SharedAccessKey=uF1Oo0YdGJaA8tniYQ8YQrjACoK/Mc/xqIlmLTRfexk=;EntityPath=infromsubscriberhub" "Endpoint=sb://pubnubcom-eventhub-0122217-1252.servicebus.windows.net/;SharedAccessKeyName=outtopublisherhub;SharedAccessKey=7hQgoU4nLoxMFrpu+1UMljjNDxRVGJvIZwPmx0GLK6w=;EntityPath=outtopnpublisher"
When we initially ran the script, we ran it in “provision” mode, which meant it was listening for a new instance of the Azure deployment to complete, send its connection string information, as well as its Event Hub Input/Output data.
What if we need to reconnect at another time (or from another computer) and monitor the Input/Output (Ingress/Egress Event Hub) data at a future time?
By pasting the command line provided into a terminal on any machine that has this script (and node dependencies) installed, we can reconnect at any time and monitor the data as PubNub publishes it in (via the Ingress Event Hub) or as PubNub publishes it out (via the Egress Event Hub.)
Ingress Event Hub Connection String:
Endpoint=sb://pubnubcom-eventhub-0122217-1252.servicebus.windows.net/;SharedAccessKeyName=infromsubscriberhub;SharedAccessKey=uF1Oo0YdGJaA8tniYQ8YQrjACoK/Mc/xqIlmLTRfexk=;EntityPath=infromsubscriberhub
Egress Event Hub Connection String:
Endpoint=sb://pubnubcom-eventhub-0122217-1252.servicebus.windows.net/;SharedAccessKeyName=outtopublisherhub;SharedAccessKey=7hQgoU4nLoxMFrpu+1UMljjNDxRVGJvIZwPmx0GLK6w=;EntityPath=outtopnpublisher
If we don’t care to reconnect via the script, but are interesting in the connection strings for the Event Hubs for other purposes, the above data is provided for just that scenario.
Waiting for messages to arrive via Event Hubs...
Message Received on Ingress Event Hub:   : {"timestamp":"2017-01-23T23:30:30.996Z","Novato":{"geo":"38.1074° N, 122.5697° W","temperature":{"F":"99.9","C":"37.7"},"humidity":"40.907","barometric":"1011.4","pollution":3,"uv":9.5,"noise":"29.26508"},"Redmond":{"geo":"47.6740° N, 122.1215° W","temperature":{"F":"75.9","C":"24.4"},"humidity":"60.918","barometric":"1011.3","pollution":6,"uv":5.7,"noise":"38.94057"},"San Francisco":{"geo":"37.7749° N, 122.4194°
And finally, the above data demonstrates that the data from the PubNub subscriber node (via the Ingress Event Hub) is ferrying into the Azure system. Later on, as we ferry data back out via the Egress Event Hub, that data will also be visible through this same script output.
NOTE: Having the announcement feature enabled is useful for learning how to use and debug the system, but a security risk in production environments. Please read about how to disable the announcement script in the README, as well as the Caveats section just below it, to learn more about the feature, and how to disable it for production.
Monitoring the PubNub Real-time Data Streams
In addition to monitoring the Event Hub data, we can also monitor the PubNub Data Streams via the PubNub Debug Console, available at https://www.pubnub.com/docs/console/. Just enter mspowerpi for both the Publish and Subscribe keys, and sensor-network for the Channel, click Subscribe, and you should see similar data as from the provisioning script, except natively from the PubNub-side (the same data endpoint that is being fed into the Azure system.)
A Critical Checkpoint!
Once the Azure Portal’s notification widget states that the “Deployment has completed”, it can take up to five minutes to see the data streaming from the provisioningListener.js console — this is due to the asynchronous nature of the Azure deployment.
If you do not see data streaming from the provisioningListener.js script within five minutes of the Portal indicating that the deployment is complete, delete the custom resource group you created, and try the steps again. If you continue to have issues, contact us at support@pubnub.com and we can assist you with troubleshooting.
As we approach completion of Phase 1, the following chart illustrates the progress of our implementation; items in blue have existed from the start (are not part of what we’re building in this tutorial), and the items in orange depict what was provisioned in Phase 1. Items in white are to be completed in the next phases of the tutorial.
Phase 2: Integrating an Azure Stream Analytics Component
Upon completion of Phase 1, we have PubNub to Event Hub bridging in place. The PubNub sensor-network data is being actively fed into Azure (via the Ingress Event Hub).
Next, we’ll add an Azure Stream Analytics component to act on the inbound data, perform an operation on it, and then output it back out through the Egress Event Hub.
Adding and Configuring the Stream Analytics Component
To add the Azure Stream Analytics component:
- In the Azure Portal, click the Resource Groups icon, which resembles a cube in brackets.

After clicking on it, the Resource Groups screen should appear.
- Click on the Resource Group you defined in the Quickstart Template. In our example, this would be pnms1.
The pnms1 Resource Group screen should appear.
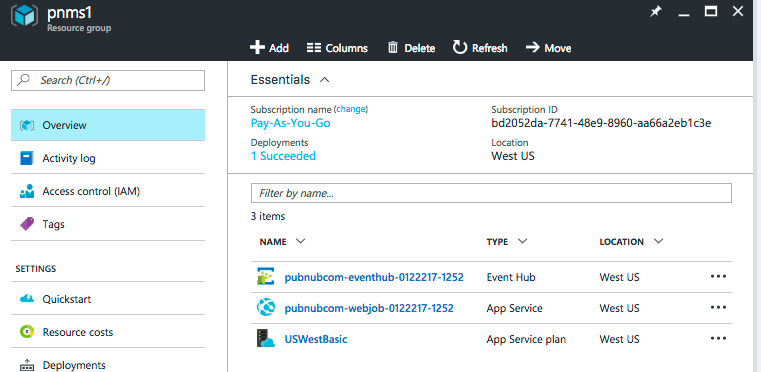
From this screen, we’ll add the Stream Analytics component.
- Click on the Add icon.
The Everything screen appears.
- In the Search Everything field, enter Stream Analytics job and press Enter.
- Select Stream Analytics job from the results.
The Stream Analytics job screen appears.
- Click Create at the bottom of the screen.
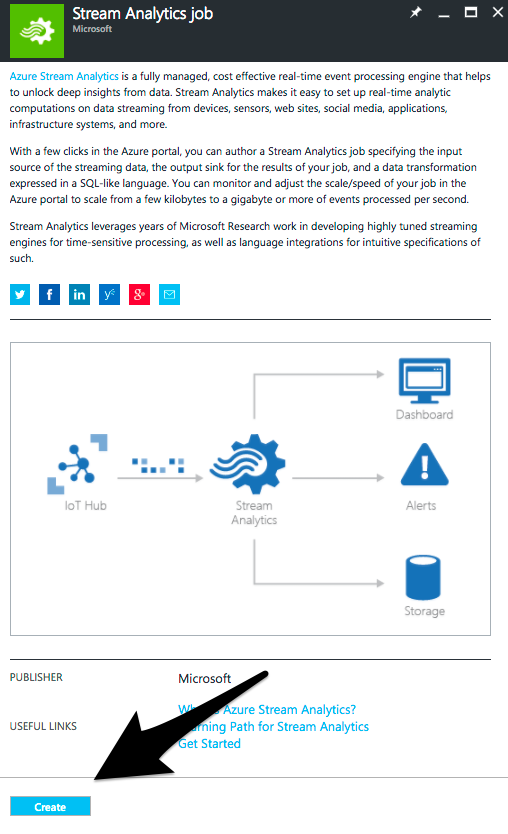
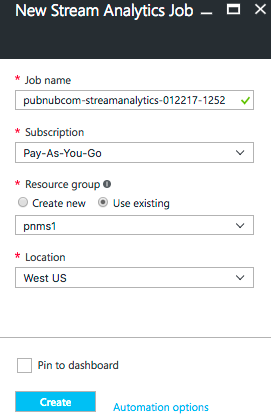
The New Stream Analytics Job screen appears.
- For Job Name, enter a unique name for the Stream Analytics job. Follow the same naming conventions as for Event Hub Namespaces to ensure you have a unique, legal string.
- For Subscription, enter a valid option. For me, it is Pay-As-You-Go.
- For Resource Group, select Use Existing, and select the same Resource Group you used originally in the Quickstart Template in our case, pnms1.
- For Location, enter West US.
When you’re done, the screen should look similar to below:
- Click Create.
Azure will provision a new Stream Analytics job. When it's done, you’ll notice a new message waiting in the notifications menu item. Click on it to confirm the Stream Analytics job deployment was successful.
Binding the Ingress and Egress Event Hubs as Inputs and Outputs to Stream Analytics
Now that we’ve created the Stream Analytics component, we’ll need to bind our Event Hubs to it as inputs and outputs.

- In the Azure Portal, click the Resource Groups icon, which resembles a cube in brackets.
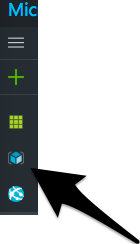
After clicking on it, the Resource Groups screen should appear.
- Click on the Resource Group you defined in the Quickstart Template. In our example, this would be pnms1.
The pnms1 Resource Group screen should appear, and you should now notice the new Stream Analytics job.
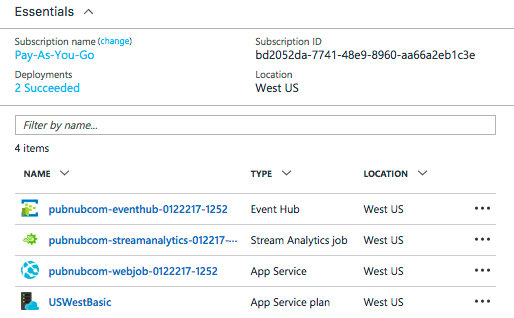
- Click on the newly created Stream Analytics job.
The Stream Analytics job screen should appear:
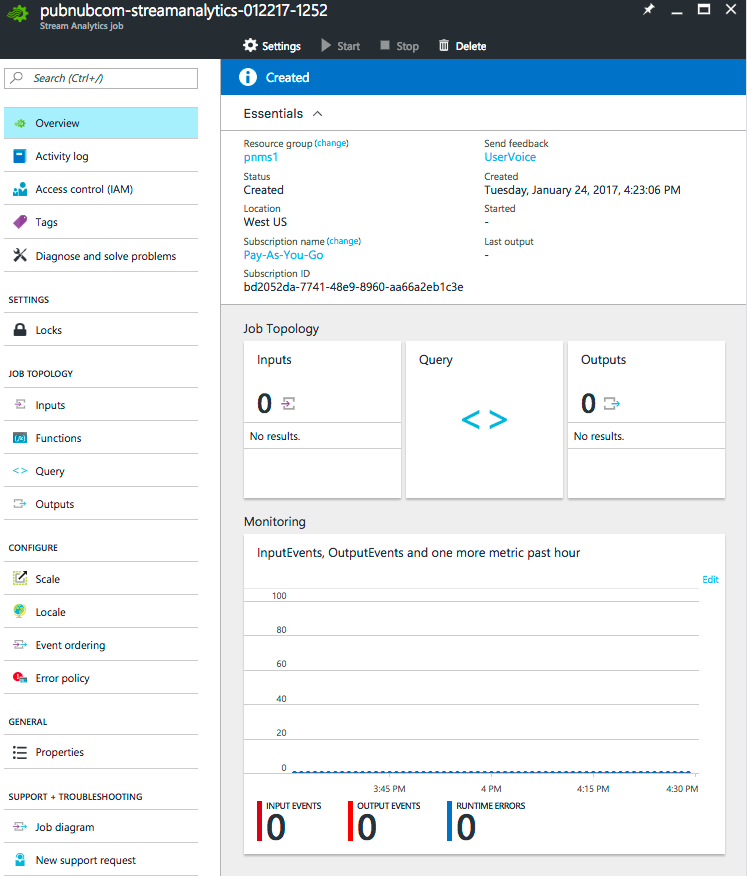
Defining the Stream Analytics Inputs
- Under Job Topology, click Inputs.
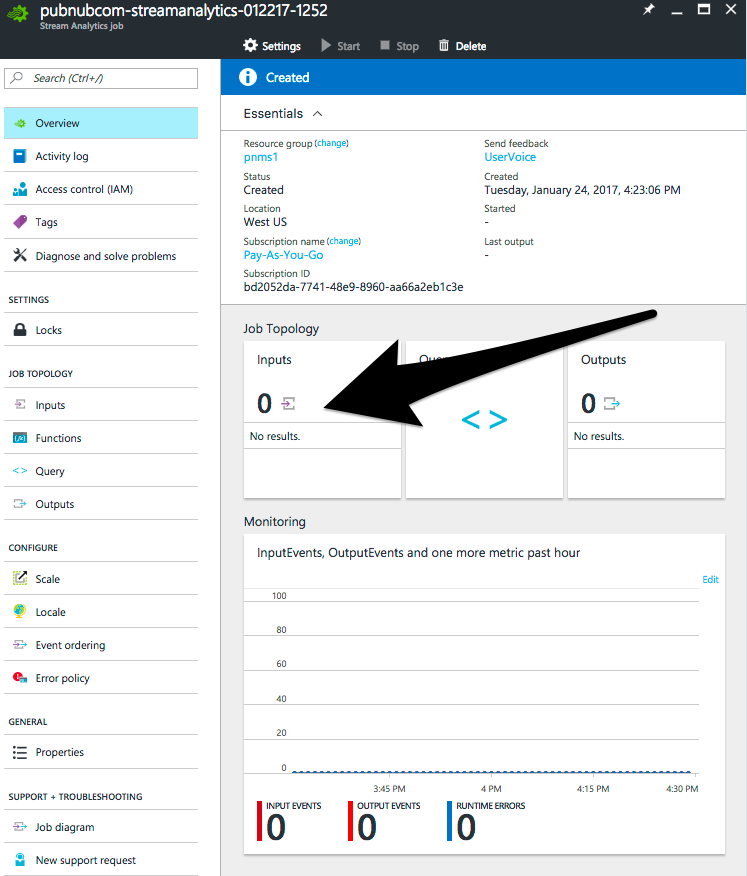
The Inputs screen should appear.
From the Inputs screen, click on the Add icon.
The New Input screen should appear.
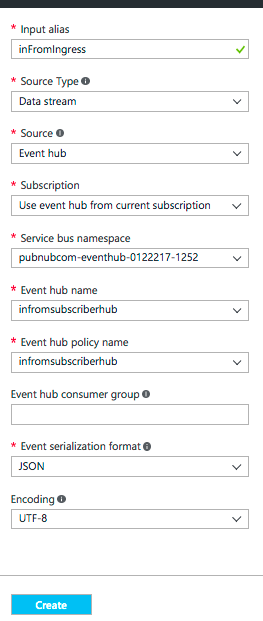
- For Input Alias, enter inFromIngress.
- For Source Type, select Data Stream.
- For Source, select Event Hub.
- For Subscription, enter Use event hub from current subscription.
- For Service bus namespace, select the namespace you defined in the Quickstart Template.
- For Event hub name, select the Ingress Event Hub you defined in the Quickstart Template. In our example, it is infromsubscriberhub.
- For Event hub policy name, select the Ingress SAS Policy Name you defined in the Quickstart Template. In our example, it is infromsubscriberhub.
- For Event hub consumer group, leave it blank.
- For Event serialization format, select JSON.
- For Encoding, select UTF-8.
Your screen should look similar to below:
- Click Create.
In the notification area, you should see the input being added, tested, and deployed successfully.
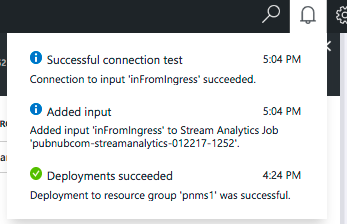
- Close the Inputs panel by clicking the X in the upper right corner of the panel.
Defining the Stream Analytics Outputs
- Under Job Topology, click Outputs.
The Outputs screen should appear.
- From the Outputs screen, click on the Add icon.
The New Input screen should appear.
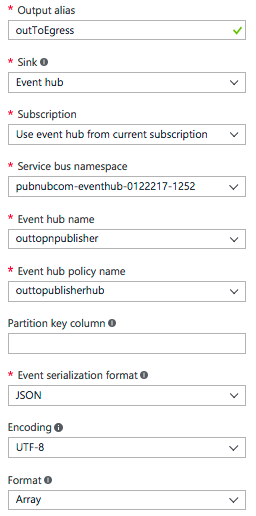
- For Output Alias, enter outToEgress.
- For Sink, select Event Hub.
- For Subscription, enter Use event hub from current subscription.
- For Service bus namespace, select the namespace you defined in the Quickstart Template.
- For Event hub name, select the Ingress Event Hub you defined in the Quickstart Template. In our example, it was outtopublisherhub.
- For Event hub policy name, select the Ingress SAS Policy Name you defined in the Quickstart Template. In our example, it is outtopublisherhub.
- For Partition key column, leave it blank.
- For Event serialization format, select JSON.
- For Encoding, select UTF-8.
- For Format, select Array.
Your screen should look similar to below:
- Click Create.
In the notification area, you should see the input being added, tested, and deployed successfully.
- Close the Outputs panel by clicking the X in the upper right corner of the panel.
Defining the Stream Analytics Query
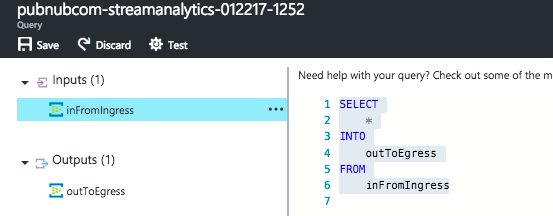
At this point, we’ve defined our inputs and outputs for Stream Analytics, but next, we’ll define a simple example pass-through query to bind the input to the output.
- Under Job Topology, click Query.
The Query screen should appear.
- Paste the following into the query field:
SELECT
   *
INTO
   outToEgress
FROM
   inFromIngress
Your Query screen should look similar to the following:
- Click Save.
In the notification area, you should see a confirmation of the saved settings.
- Close the Query panel by clicking the X in the upper right corner of the panel.
Now that we’ve setup our Query, our Stream Analytics configuration is complete! Next, we’ll start it up and see the first example of our PubNub Gateway for Azure working end-to-end!
- Click the Start icon from the top of the Stream Analytics screen.
The Start job screen should appear.
- For Job output start time, select Now
- Click Start at the bottom of the page.
In the notification area, you should be able to follow the status of the Streaming Job.
Once the job has reported that it has completed, within five minutes you should see the provisioningListener.js script outputting not only Ingress Event Hub output, but also Egress Event Hub output:
Message Received on Ingress Event Hub:   : {"timestamp":"2017-01-25T20:32:46.732Z","Novato":{"geo":"38.1074° N, 122.5697° W","temperature":{"F":"99.8","C":"37.7"},"humidity":"40.922","barometric":"1012.1","pollution":3,"uv...
Message Received on Egress Event Hub:   : [{"timestamp":"2017-01-25T20:32:40.6930000Z","Novato":{"geo":"38.1074° N, 122.5697° W","temperature":{"F":"100.0","C":"37.8"},"humidity":"40.927","barometric":"1011.1","pollution":3,"u...
Since all data sent to the Egress Event Hub is automatically forwarded to the PubNub Publisher via the Webjob component of the PubNub / Azure Quickstart Gateway, it can be observed also in real time via the PubNub Web debug console (as well as consumed in real time by any PubNub client/SDK.)
Visit https://www.pubnub.com/docs/console/ and enter mspowerpi for both the Publish and Subscribe keys, and the value you set in the Azure Quickstart Template for PubNub Egress Channel for the Debug Console’s Channel value (in our example, it was pubnubcom-egress-0122217-1252), and you should see the exact same “Egress” data as seen in the provisioning script, except natively from the PubNub data stream-side (the same data endpoint that is being fed into the Azure system.)
In the query we just defined, we created a simple pass-through of data from the Ingress Event Hub to the Egress Event Hub. This was intended as a quick smoke test to verify all the moving pieces are working together correctly.
Next, we’ll take advantage of Azure Stream Analytics functionality that will let us perform real-time event processing on the data stream.
Modifying the the Data Stream with Stream Analytics
We currently have a Stream Analytics pass-through query which outputs the source data stream back out to PubNub (via the Egress Event Hub) unmodified.
In a real-life scenario however, we’re going to use Azure Services, such as Stream Analytics, to do more than just a simple pass-through… so let’s modify our query to add a five second tumbling-window humidity average for each city in our data stream.
Creating a Tumbling Window (5-second Average) Query
Connected Cities, Inc. is having great success using PubNub to stream real-time data from sensors located in cities around the world via their sensor-network channel. Feature requests have been coming in from their users that they’d like a calculated “average humidity” attribute added for each city, alongside the existing humidity field.
We’ll now walk through the steps required to replace the pass-through query with a more meaningful one, one that calculates a five second tumbling-window humidity average via an avg_humidity field, to each city in the data stream.
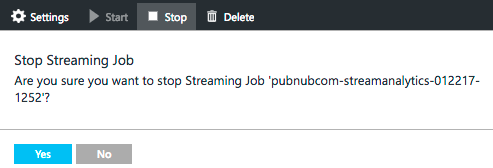
- Stop the currently running query by clicking on the Stop icon.
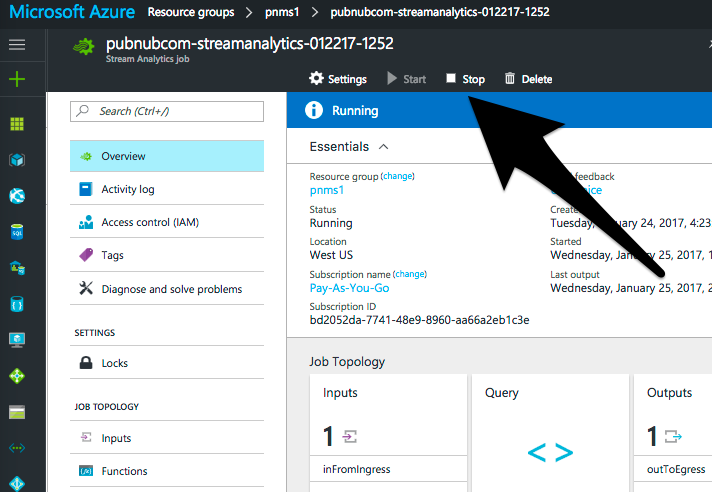
- Click Yes when the confirmation dialog appears
- Under Job Topology, click Query.
The Query screen should appear.
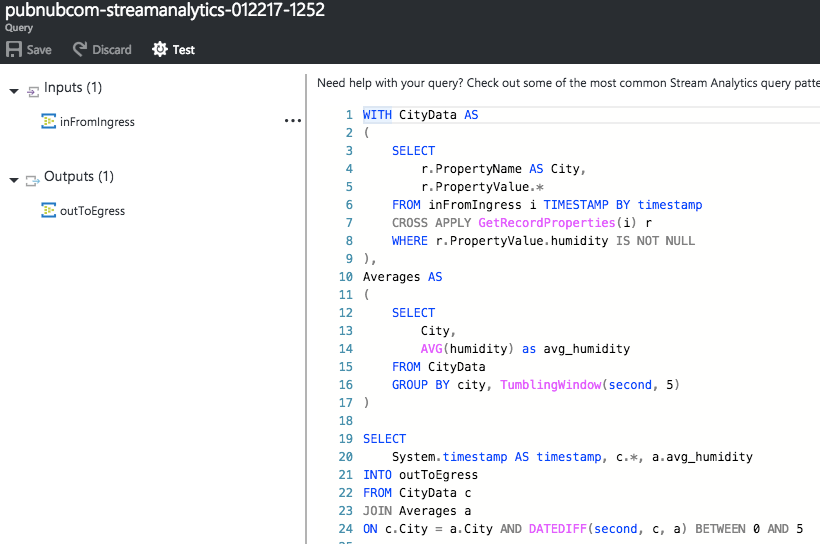
- Paste the following into the query field, replacing the existing query:
WITH CityData AS
(
   SELECT
       r.PropertyName AS City,
       r.PropertyValue.*
   FROM inFromIngress i TIMESTAMP BY timestamp
   CROSS APPLY GetRecordProperties(i) r
   WHERE r.PropertyValue.humidity IS NOT NULL
),
Averages AS
(
   SELECT
       City,
       AVG(humidity) as avg_humidity
   FROM CityData
   GROUP BY city, TumblingWindow(second, 5)
)
SELECT
   System.timestamp AS timestamp, c.*, a.avg_humidity
INTO outToEgress
FROM CityData c
JOIN Averages a
ON c.City = a.City AND DATEDIFF(second, c, a) BETWEEN 0 AND 5
Your Query screen should look similar to the following:
- Click Save.
In the notification area, you should see a confirmation of the saved settings.
- Close the Outputs panel by clicking the X in the upper right corner of the panel.
Now that we’ve setup our Query, our Stream Analytics configuration is complete! Next, we’ll start it up and observe the modified data stream containing the added avg_humidity field.
- Click the Start icon from the top of the Stream Analytics screen.
The Start job screen should appear.
- For Job output start time, select Now
- Click Start at the bottom of the page.
In the notification area, you should be able to follow the status of the Streaming Job.
NOTE: It may take up to 5 minutes after the portal’s success notification time to actually see this data via appear in the Azure system.
Within five minutes you should see the provisioningListener.js script outputting not only the Ingress Event Hub output (the original input coming in via PubNub), but also the new Egress Event Hub output, containing the five-second average humidity data:
Message Received on Ingress Event Hub:   : {"timestamp":"2017-01-27T23:33:30.303Z","Novato":{"geo":"38.1074° N, 122.5697° W","temperature":{"F":"100.0","C":"37.8"},"humidity":"40.953","barometric":"1011.7","pollution":3,"uv":9.5,"noise":"29.27703"},"Redmond":{"geo":"47.6740° N, 122.1215° W","temperature":{"F":"75.9","C":"24.4"},"humidity":"60.482","barometric":"1011.4","pollution":6,"uv":...}}
Message Received on Egress Event Hub:   : [{"city":"Honolulu","geo":"21.3069° N, 157.8583° W","temperature":{"F":"104.8","C":"40.5"},"humidity":"66.968","barometric":"1011.6","pollution":4,"uv":10.4,"noise":"53.59111","avg_humidity":66.9477},{"city":"Honolulu","geo":"21.3069° N, 157.8583° W","temperature":{"F":"105.0","C":"40.5"},"humidity":"66.968","barometric":"1011.7","pollution":4,"uv":10.4,"noise":"54.69075","avg_humidity":66.9477},{"city":"Honolulu","geo":"21.3069° N, 157.8583° W","temperature":{"F":"104.8","C":"40.5"},"humidity":"66.981","barometric":"1011.9","pollution":4,"uv":10.4,"noise":"54.78662","avg_humidity":66.9477},{"city":"Honolulu","geo":"21.3069° N, 157.8583° W","temperature":{"F":"104.8","C":"40.4"},"humidity":"66.947","barometric":"1011.3","pollution":4,"uv"...}]
For clarity, pretty-printed, our new data stream looks like:
[{
    "timestamp": "2017-01-28T00:09:35.6030000Z",
    "city": "Novato",
    "geo": "38.1074° N, 122.5697° W",
    "temperature": {
        "F": "99.9",
        "C": "37.7"
},
    "humidity": "40.950",
    "barometric": "1011.4",
    "pollution": 3,
    "uv": 9.5,
    "noise": "28.51730",
    "avg_humidity": 40.960699999999996
}, {
    "timestamp": "2017-01-28T00:09:35.6030000Z",
    "city": "Redmond",
    "geo": "47.6740° N, 122.1215° W",
    "temperature": {
    "F": "75.9",
    "C": "24.4"
},
    "humidity": "60.203",
    "barometric": "1011.5",
    "pollution": 6,
    "uv": 5.7,
    "noise": "39.44955",
    "avg_humidity": 60.52385
}, {
...
}]
Since all data sent to the Egress Event Hub is automatically forwarded to the PubNub Publisher via the Webjob component of the PubNub / Azure Quickstart Gateway, this egress data can also be observed in real time via the PubNub Web debug console (as well as consumed in real time by any PubNub client/SDK.)
Visit https://www.pubnub.com/docs/console/ and enter mspowerpi for both the Publish and Subscribe keys, and the value you set in the Azure Quickstart Template for PubNub Egress Channel for the Debug Console’s Channel value (in our example, it was pubnubcom-egress-0122217-1252) and click Subscribe, and you should see the exact same “Egress” data as seen in the provisioning script, except natively from the PubNub data stream-side (the same data endpoint that is being fed into the Azure system.)
As we approach completion of Phase 2, the following chart illustrates the progress of our implementation; items in blue have existed from the start (are not part of what we’re building in this tutorial), and the items in orange depict what was provisioned in Phases 1 and 2. The remaining item in white will be completed in this upcoming last phase of the tutorial.

Phase 3: Visualizing the Data in Real time with Microsoft Power BI
So far we’ve demonstrated how our smart city data can be bridged into the Azure cloud for additional processing and functionality for scientific and educational purposes, such as advanced average calculations of weather data.
In the final phase of this tutorial, we’ll explore a ‘sobering’ use case for PubNub, Azure, and Power BI — late-night noise control for an outdoor beer garden!
Monitoring and Visualizing Noise-levels
At a famous Novato, CA. beer garden haunt named The Time Ghost, it’s been a hot summer and good economy, and that’s fueled the late-night crowd presence from the afternoon all the way into the early morning hours. Normally, that’s a good thing, but with crowds and alcohol come noise, and with late night noise come unhappy neighbors.
The city has been receiving many noise complaints from neighbors, and The Time Ghost has been consulting with city officials on methods to quell the volume without having to hire more staff.
A member of the city board, Randy Kap (who is by coincidence also a longtime patron of The Time Ghost), noticed that the city’s noise sensor array is located on a light pole just outside of the beer garden… and it gave him a fantastic idea!
He suggested that The Time Ghost utilize the noise sensor readings on a Power BI dashboard to alert staff when noise levels reach excessive, anomalous levels. Displaying the maximum noise level in a line chart over a 5 second window would be a great way to keep tabs on noise situation.
And since these charts can be monitored on the staffs’ smartphones, as well as on a dashboard running behind the bar, it would be a lot easier to nip the noise escalations in the bud in real time, as they happen.
Randy checked with his contact Scott Daniels at Connected Cities, Inc., and requested that a special Power BI chart be created just for this use case. Scott let Randy know this since they were using PubNub, Azure, and Power BI, it was a trivial feature to implement, and that charts would be available for The Time Ghost to use the same evening!
In order to achieve this functionality, just a few additional steps are required:
- Add a Stream Analytics Output for Power BI.
- Create the Five-second Maximum Noise Stream Analytics Query.
- Add a Power BI Chart that displays the Max Noise Line Chart.
Add a Stream Analytics Output for Power BI
Earlier in this tutorial, we created an outToEgress output for Stream Analytics that enables output back out to PubNub. We’ll now create a second output called noiseMonitor that will serve as an output to Power BI.
From the Stream Analytics screen:
- Stop the currently running query by clicking on the Stop icon.

- Click Yes when the confirmation dialog appears.

- Under Job Topology, click Outputs.
The Outputs screen should appear.
- From the Outputs screen, click on the Add icon.
The New Output screen should appear.
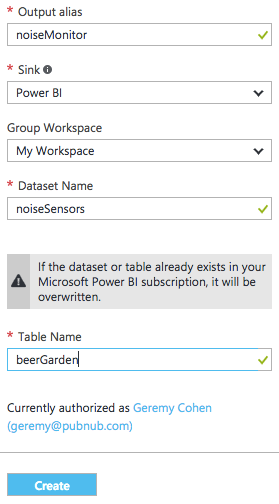
- For Output Alias, enter noiseMonitor.
- For Sink, select Power BI.
- Click Authorize and grant Power BI access to this output.
- For Group Workspace, accept the Default.
- For Dataset Name, enter noiseSensors.
- For Table Name, enter beerGarden.
Your screen should look similar to below:
- Click Create.
Azure will provision a new Stream Analytics output. When it's done, you’ll notice a new message waiting in the notifications menu item. Click on it to confirm the creation was successful.
Create the Five-second Maximum Noise Stream Analytics Query
Now that we’ve created the output, lets create a query that calculates the maximum noise value over the last five seconds, and sends that calculated data stream to our noiseMonitor output.
- Under Job Topology, click Query.
The Query screen should appear.
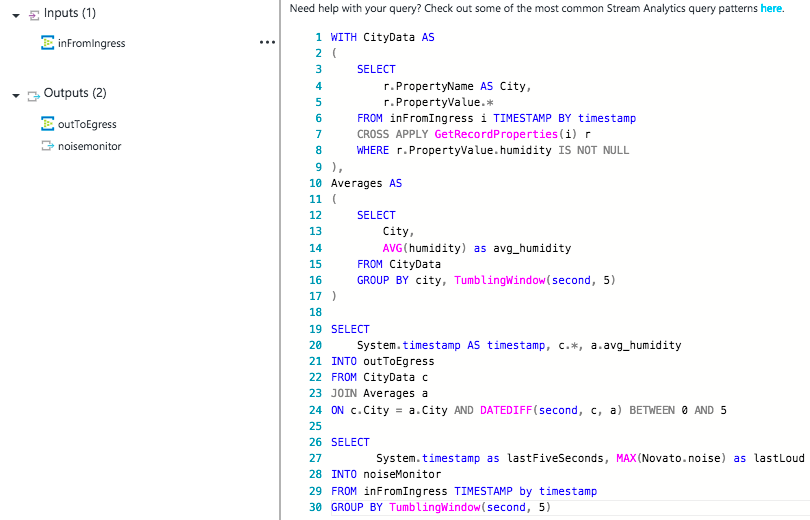
- Below the existing query, paste the following into the query field:
SELECT
      System.timestamp as lastFiveSeconds, MAX(Novato.noise) as lastLoud
INTO noiseMonitor
FROM inFromIngress TIMESTAMP by timestamp
GROUP BY TumblingWindow(second, 5)
This new query will calculate Novato’s maximum noise value over a five-second “TumblingWindow”.
Once pasted, your Query Screen should contain these multiple queries:
- Click Save.
In the notification area, you should see a confirmation of the saved settings.
- Close the Query panel by clicking the X in the upper right corner of the panel.
- Click the Start icon from the top of the Stream Analytics screen.
The Start job screen should appear.
- For Job output start time, select Now
- Click Start at the bottom of the page.
Now that the query is running, let's implement the final piece — the Power BI chart that is a real-time indicator whether noise levels are too high.
Add a Power BI Chart that displays the Max Noise Line Chart
Now that we have our data stream output via Azure Stream Analytics, we’ll easily chart it using Power BI.
- Browse to https://powerbi.microsoft.com/en-us/.
- Login.
Defining a New Dashboard
If you’ve already setup Power BI in the past, then when you login, go ahead and skip to the Previously Setup Account section below.
If this is your first time logging in to Power BI, follow the Newly Setup Account instructions below.
Newly Setup Account
When you first login to Power BI, you will be presented with the Welcome screen.
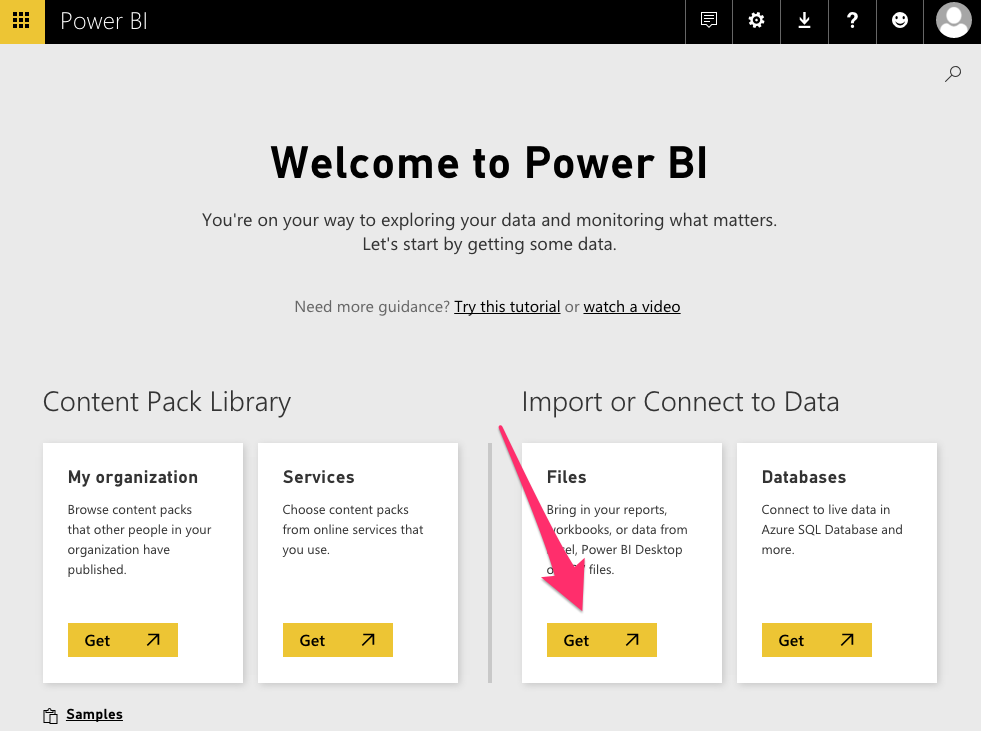
- Click Get under Files.
The Files menu appears.
- Click < My Workspace to return to the Workspace screen.
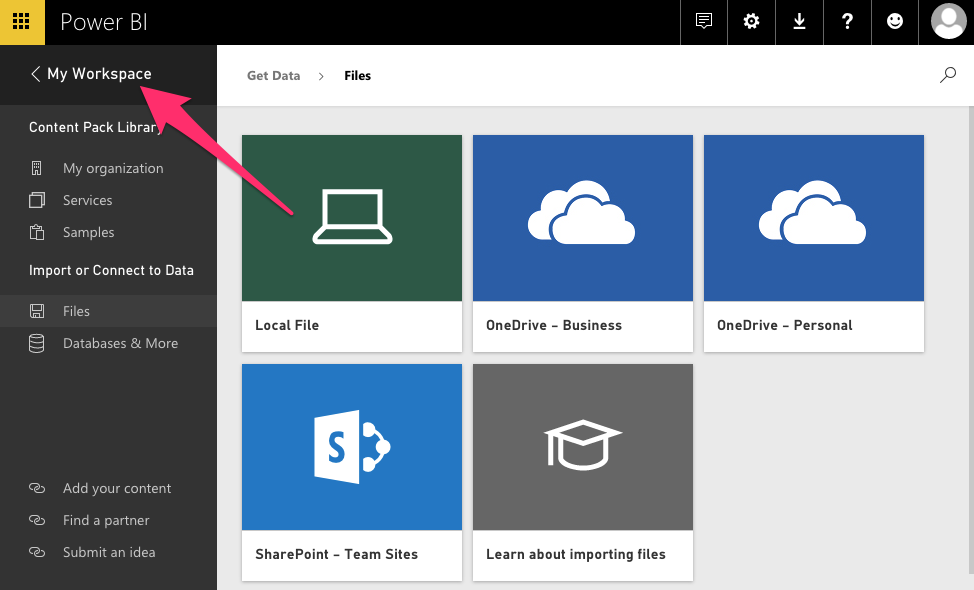
Proceed to the Previously Setup Account section below to continue.
Previously Setup Account
- Expand the Power BI left menu by clicking the three horizontal lines on the collapsed menu bar.

Once expanded, the left menu should look similar to this:
NOTE: If this your first time using Power BI, the three horizontal lines may not be visible. If this is the case, instead, click Sample Data.
- Click on the + (plus-sign) under Dashboards.
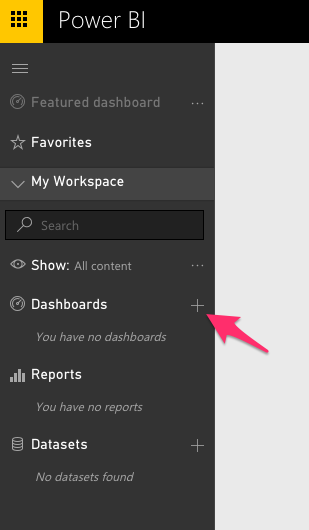
A text field will appear.
- Enter PubNub Sensor Cluster in the text field, then press the enter key.
- Click on the newly created PubNub Sensor Cluster.
You’ll now be viewing the empty PubNub Sensor Cluster Dashboard.
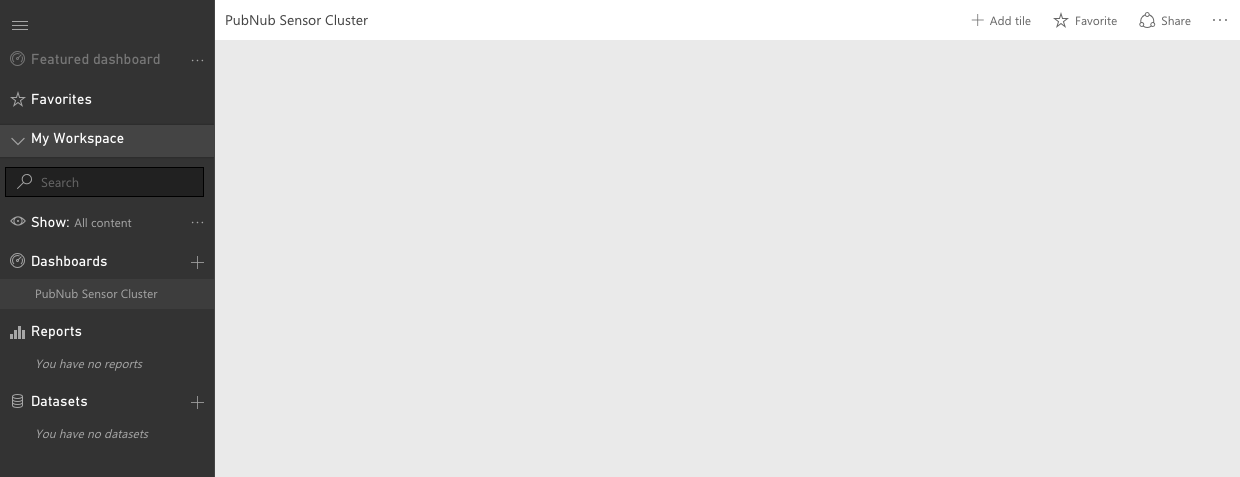
Next, lets add a Line Chart to the Dashboard that will help our bar staff monitor noise in their beer garden!
Creating the Line Chart
- Click the + next to Add Tile (located in the upper right of the screen.)
The Add tile panel appears.
- Click the CUSTOM STREAMING DATA button, located below the REAL-TIME DATA heading, then click Next.
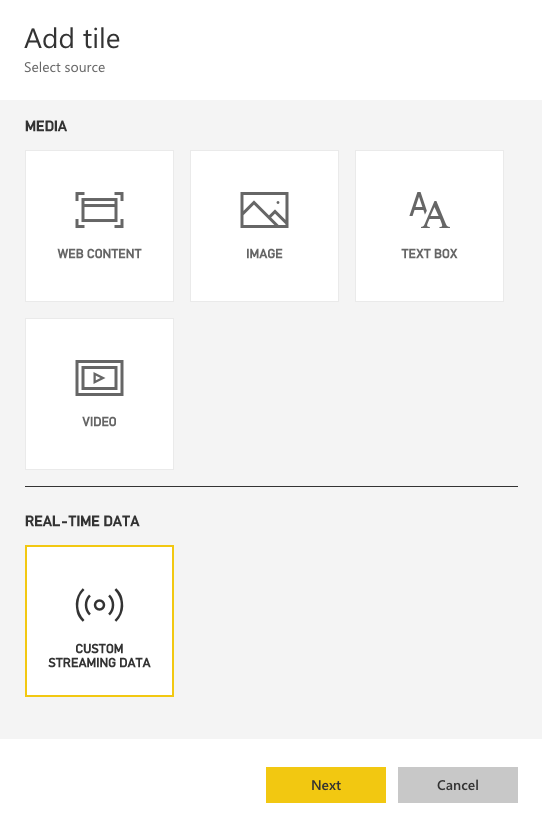
The Add a custom streaming data tile panel appears.
You should see the noiseSensors dataset. It will have been automatically created in Power BI for you because it was defined in Stream Analytics as a Power BI output
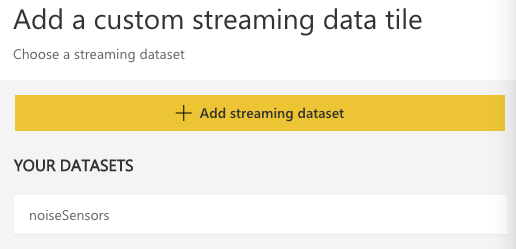
- Click on noiseSensors.
- Click Next.
The Add a Custom Streaming Data Tile screen should appear.
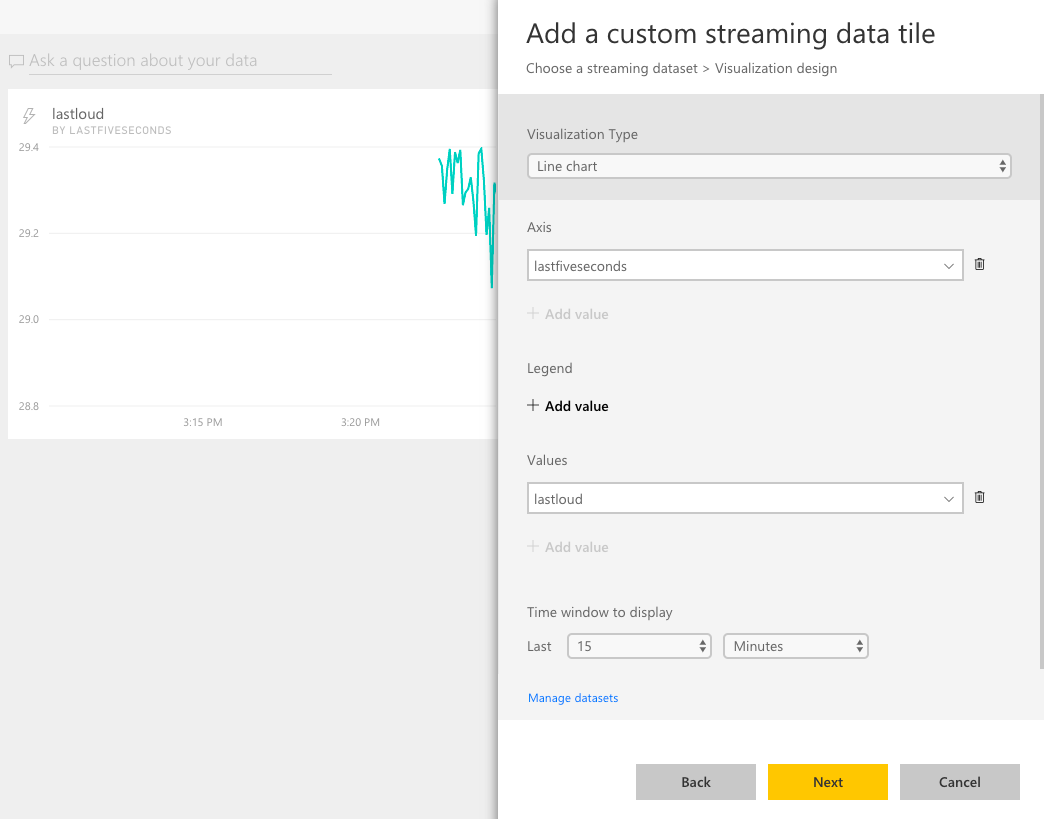
- For Visualization Type, select Line Chart.
- For Axis, click + Add Value, and select lastfiveseconds.
- For Values, click + Add Value, and select lastloud.
- For Time Window to Display, select Last 15 Minutes.
Your screen should look similar to the example below:
- Click Next.
The Tile Details screen should appear.
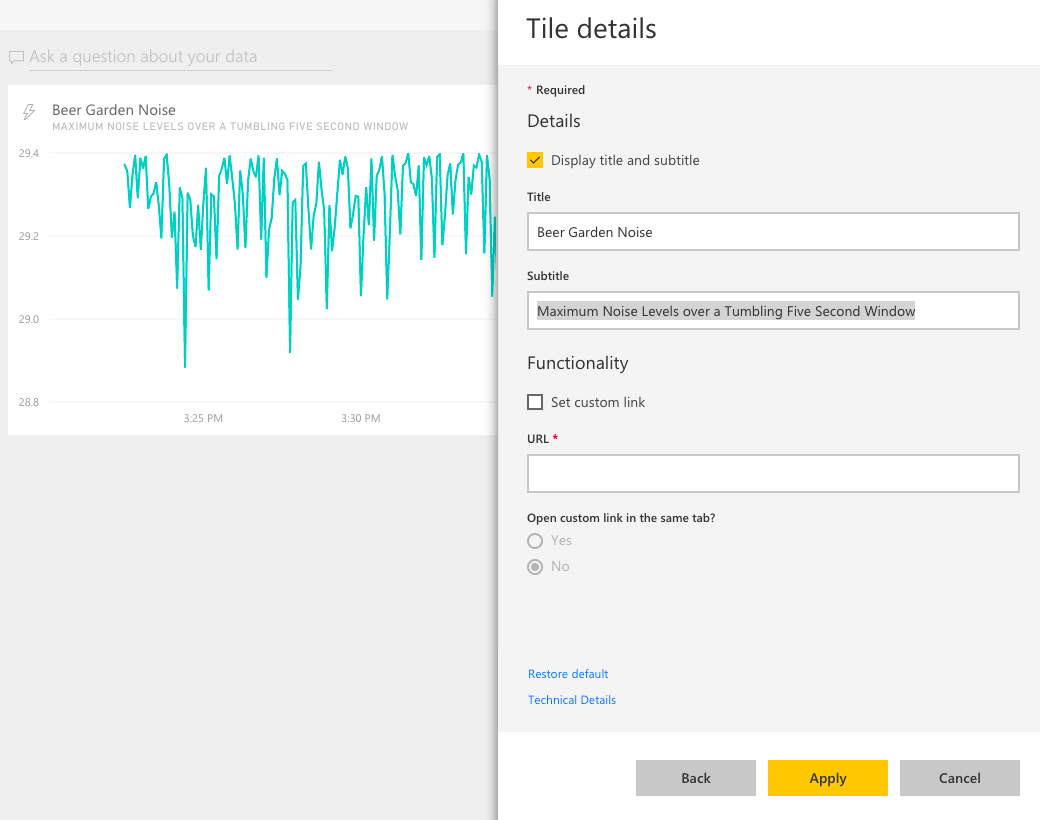
- Check Display title and subtitle.
- For Title, enter Beer Garden Noise.
- For Subtitle, enter Maximum Noise Levels over a Tumbling Five Second Window.
Your screen should look similar to the example below:
- Click Apply.
A chart displaying five-second maximum sound values now displays in real time, allowing those in the know to keep a close monitor on escalating customer noise, anytime of the day and night!
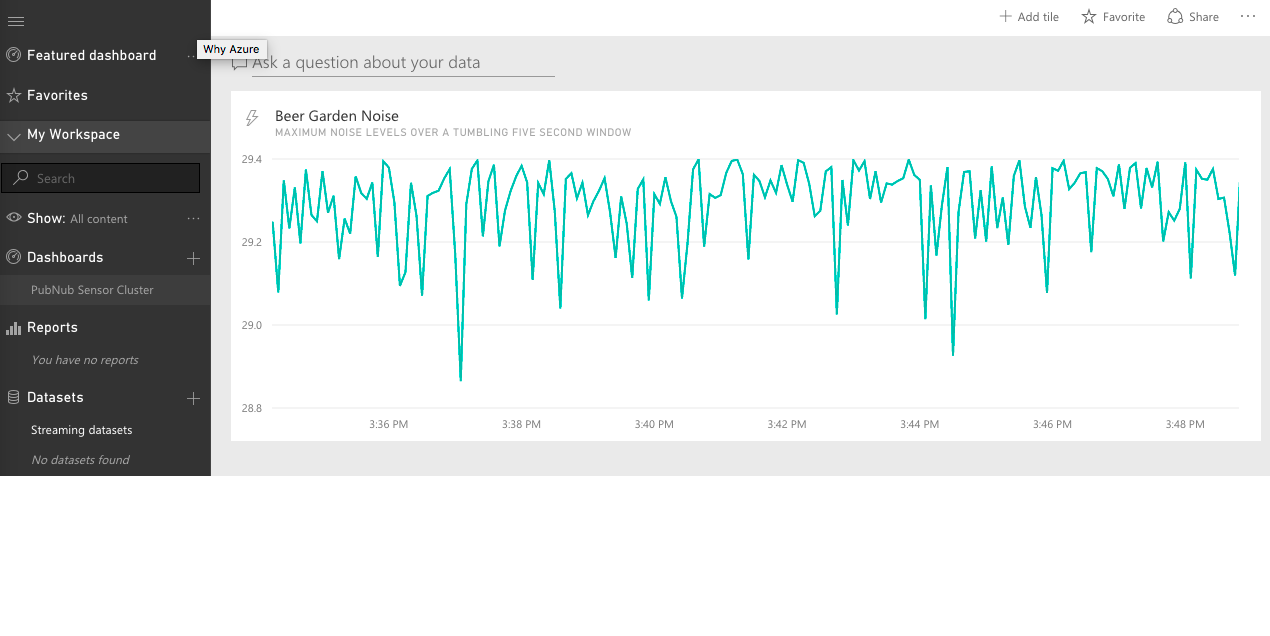
The staff of The Time Ghost now has the tools they need to keep a closer eye on noise levels. Even the owner of the bar can keep an eye on noise levels from his home and gently remind his employees from afar, a feature we know the staff will love!
As we complete Phase 3, the following chart illustrates the final implementation; items in blue have existed from the start (are not part of what we’re building in this tutorial), and the items in orange depict what was provisioned in Phases 1, 2, and 3.
Conclusion
As we wrap up this tutorial, we hope that we’ve created a useful demonstration of how data streams running on the PubNub network can be fed into Microsoft Azure’s Cloud services, as well as visualized via Microsoft Power BI.
This tutorial skims the surface on the features PubNub and Microsoft can together offer. For example, on the visualization side, from here it’s easy to create Power BI report visuals, which when pinned to dashboards, also update in real time! Using report visuals opens the door to a number of exciting Power BI features, e.g. alerting, custom visuals, etc.
If you’re looking for additional information on how to enhance or modify this implementation to better serve your own use case, don’t hesitate to contact us at support@pubnub.com.
Your feedback will not only allow us to help you with your specific PubNub/Azure/Power BI implementations, but will help drive the content for the next tutorial in the series.
Thanks, and Happy Real-time with PubNub and Microsoft!