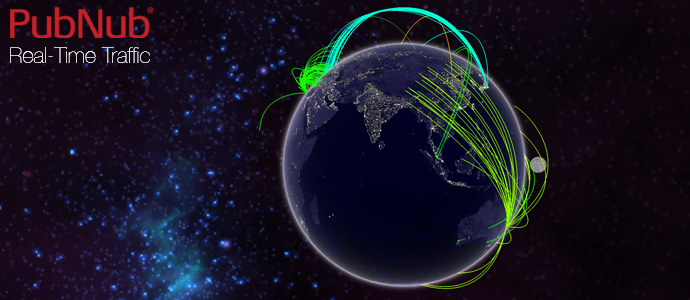
 Sometimes grasping what a data set means is tough when it’s sitting in a spreadsheet. Luckily, with the tools we have today on the web, we can build much more meaningful visualizations to further understand our data. At PubNub, we send millions of requests per day, and to fully understand this data, we built a real-time visualization of our data which can be seen on our PubNub Network Page today.
A great way to show visitors our global scale, we keep this map running on our office TV screen throughout the day. However, I thought we could do much better. After seeing some of the stunning WebGL visualizations by the Google Data Arts Team, I wanted to do the same with our real-time data feed. Using WebGL, I upgraded our 2D canvas into a 3D one and used WebGL to represent our data on a spherical globe.
Want to see it in action? Check out the Live Demo below:
WebGL Brings 3D to the Browser
WebGL is a leap forward in what it enables JavaScript engineers to do in the browser. It brings the power of OpenGL, which has typically been used in lower level languages for games and visualizations alike, and exposes it to JavaScript. Now, any web page can utilize WebGL to create a 3D scene in their web page and have it be hardware accelerated using the computer’s GPU.
Bringing 3D to the Cloud
Now that WebGL is a built in component in the browser, we can extend its power through cloud services. Anything that supports JavaScript through protocols such as AJAX, WebSockets, or WebRTC can now be integrated with a WebGL application! This is great for us at PubNub because now we can use PubNub Data Streams to build interesting WebGL Visualizations.

Fetching Real-time Data
Obtaining the data for our visualization was the easiest step. At PubNub, we publish a small subset of our real-time traffic on a channel. This includes latitude and longitude coordinates for the origin of the publishes and subscribes. From here, we feed this data into a function that adds geometry to WebGL to visualize these lines on the globe.
You’ll first need to sign up for a PubNub account. Once you sign up, you can get your unique PubNub keys in the PubNub Developer Portal. You can then input your publish/subscribe keys to initialize PubNub.
In this code, we are initializing our PubNub connection with our subscription key. Then we are subscribing to our channel that streams our real-time geostats. Finally we feed this into an add data function that creates the geometry for the globe. There is also a visible flag in the code to make sure we are rendering only when the tab is showing. This boosts performance considerably when switching tabs.
Making WebGL Interactive
One of the next steps was allowing the user to control the scene via simple mouse controls. This included simple clicking and dragging for panning and zooming in and out. The best way to do this was to create and move a target. Then, every frame, I would move the globe towards that target in 3D space. You can see the code for that here:
Here we save the current target when the user presses the mouse. Then when the mouse moves the target is moved based on how far the mouse is from the original spot. This allows for panning the globe, but to make it zoom we have to use some additional code on mouse wheel:
This will take the delta Y when moving the mouse wheel and change the distance from the target. This code is brought together by the render loop which takes this information and moves the globe towards our target rotation and zoom level:
 Now the globe will move towards the target every time it is rendered. As an added flourish, I’m also checking when the user has not interacted with the globe for more than three seconds. When this happens it triggers code to move the globe on its own, making for a cool effect when sitting on the company TV.
Endless Possibilities
This is a small subset of the things that are possible with WebGL. Much of the inspiration for this project came from the outstanding work on the three.js examples page and Chrome Experiments. Combined with real-time data, we can build enhanced visualizations, interactive media applications, and even multiplayer games. Be sure to check out our blog for future updates on what WebGL projects we come up with next.