Power a Real-time Voting App with Live Results Using D3js

Say you want to build a survey or voting app that displays poll results in real time, as the votes come in. Because sometimes the conventional way of collecting votes just doesn't cut it, we're going to build a real-time voting app that displays live updating results as they happen.
However, we also want it to look pretty, so to bring it to life and more interactive, results will be displayed using D3js.
In this tutorial, we will show how we can use D3JS to draw the graph with some dataset and PubNub to respond to people’s votes and dynamically update the graph in everyone’s browser in real time. We'll build the real-time voting app, then broadcast the live result as votes come in.
D3js: Bringing Data to Life
D3js a JavaScript library that helps you visualize data in a format that's easily understandable. For example, if you have an array of numbers you can display it in line charts, bar charts, pie charts, and more. Although this is a simple tutorial, I recommend you take a quick peek as the official D3js reference for a few minutes to get a better grasp of the library and see what can be accomplished.
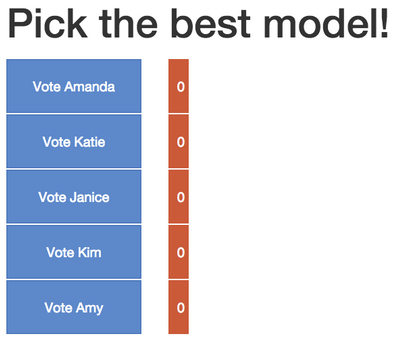
Since we want to have a dynamic voting app that shows each vote (in our example, a beauty pageant) in real time, this is how our end result will look. The bars will grow bigger and smaller as each model's votes are tallied.
Getting Started: HTML and CSS
Let’s start with a boilerplate html first.
Initializing PubNub
Now that we have a basic container ready, let’s start implementing the bar graph. You’ll first need to sign up for a PubNub account. Once you sign up, you can get your unique PubNub keys in the PubNub Developer Portal.
Once you have, clone the GitHub repository, and enter your unique PubNub keys on the PubNub initialization.
We should also have the data we want to visualize. In this case, it's a list of models initialized with 0 votes.
Enabling Voting
As people cast votes, the bar graph will have to update itself to show how popular the models are. Therefore, we need to "listen to" each person's submitting vote, and render the bar graph again.
By subscribing to a channel "survey", every time a new message is published in the channel we call the function "increment." The function increment(modelName) increases the number of votes for the model by 1. For example, calling increment(Amanda) for the first time will make Amanda’s number of votes 1.
The message we publish to the channel will be the model's name. We find the model's name in the given data array and increase its number of votes by one. Then, we have to render the graph again with the updated data. This is where D3js comes into play.
For each element in the array, we draw a bar whose width is scaled by the number of its votes. We also make a button that calls sendData(modelName) when clicked, and it should publish each voting action across the channel.
Voting History: Implementing Storage & Playback
Open up two browsers side by side and vote for one of the models. You will notice the bar graph is updated in both browsers and you didn’t have to refresh the page.
However, it needs some improvements. If you open up another browser, you will see that all the votes start from 0. People who join the fashion show late will be looking at the wrong graph and think no one has voted yet. How do we solve this problem?
Thankfully, PubNub provides a Storage & Playback call that retrieves the messages that have already been published. When we open the survey page, instead of initializing the number of votes to 0 we should initialize it according to the voting history.
Now open one browser and vote for some models. Then open another browser, and you will see all the votes are correctly represented unlike before! In the end, you should have this.
Wrapping Up with D3js
Where do we go from here? Since the example is just to show the bare minimum you can achieve with combining D3JS and PubNub, you can get a lot more creative. You can build bubble charts based on streaming data, plot trading and financial information on a live updating line graph, or create dynamic word clouds based on content just to name a few. Good thing we have demos and tutorials for all of these (and a lot more in the works).
I hope you find this useful, and feedback is always welcome.
