Plotly Goes Real-time with PubNub and Node.js
This tutorial is a quick and easy example of Real-time Updates using PubNub to stream updates and display the change in a live-updating chart.
What good is data if it's outdated? The answer is pretty clear. As a result, real-time dashboards, charts and graphs that update as the data changes, continue to innovate how we process and view data.
From seeing how much traffic a website is getting, collecting data from IoT devices to see patterns in data gathered or how many users opened a marketing email leading to conversions, real-time dashboards are everywhere.
Real-time Dashboards with Plotly and PubNub
With PubNub, we have featured some of the charting libraries before like EON, EpochJS, D3.js, and more. Today we are going to look at another popular charting library – Plotly.
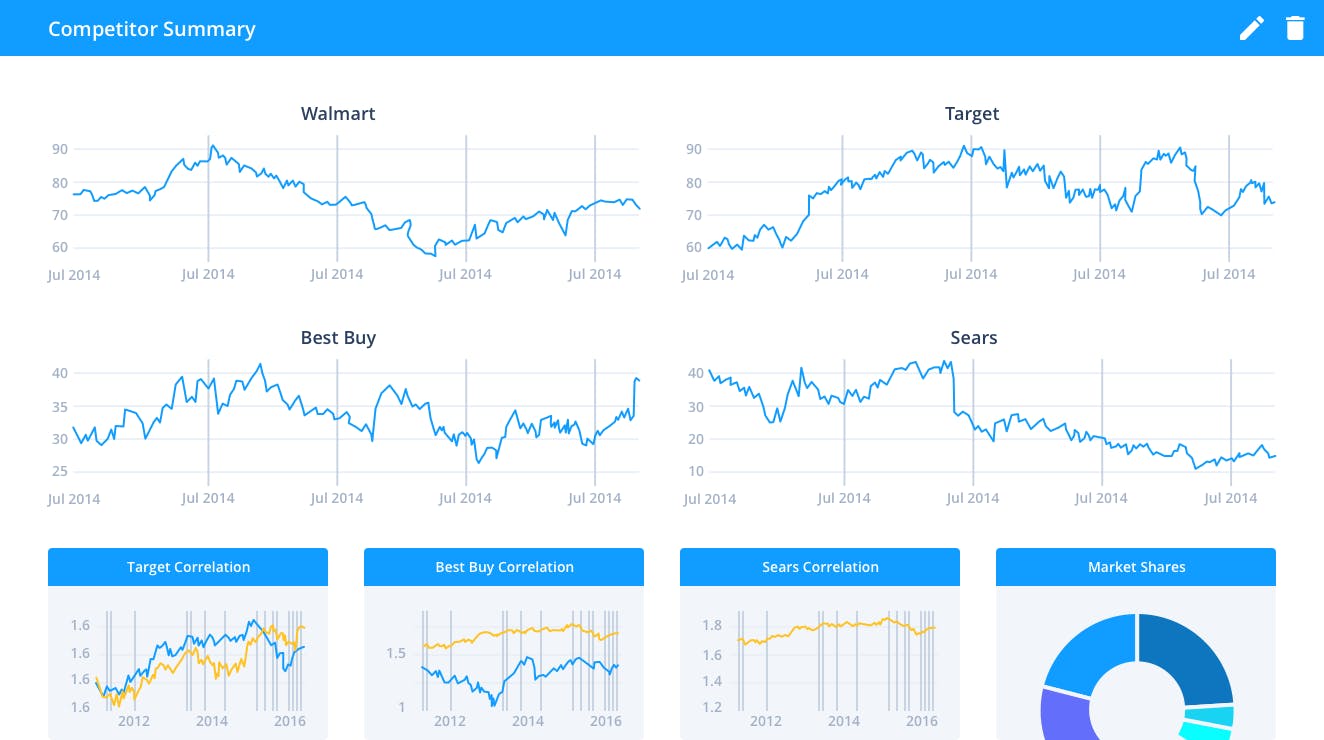
Plotly lets users easily create interactive charts and dashboards to share online with their audience. You can make charts, dashboards and slide decks using their libraries. It’s heavily used for Business Intelligence and Data Science.

Plotly lets you build powerful dashboards and charts.
Tutorial Overview
In this tutorial, we are going to stream the data from a source to Plotly via PubNub and generate a chart which updates in real time without writing a single piece of code on the frontend.
Here's our app in action:
The entire source code for real-time dashboards with PubNub and Plotly is available here.
In order to build this app, you'll have to sign up for a PubNub account to get your unique publish/subscribe keys. Worry not, PubNub is free forever (up to a certain amount of daily active devices and transactions).
pubnub-script.js
The script below does the following things:
- Brings in the pubnub and cron gem package.
- Instantiates pubnub with subscribe and publish key
- Cron creates a data every 1 second consisting of 3 events with random values.
- Data is published to pubnub-plotly channel
var pubnub = require("pubnub")({
   subscribe_key: 'YOUR SUBSCRIBE KEY', // always required
   publish_key: 'YOUR PUBLISH KEY' // only required if publishing
});
var cron = require('cron');
function randomIntInc (low, high) {
   return Math.floor(Math.random() * (high - low + 1) + low);
}
var cronJob = cron.job("*/1 * * * * *", function(){
   var data = [
       {
           "event_name": "Event1",
           "data": randomIntInc(0,9)
       },
       {
           "event_name": "Event2",
           "data": randomIntInc(0,9)
       },
       {
           "event_name": "Event3",
           "data": randomIntInc(0,9)
       }
   ]
   pubnub.publish({
       channel: "pubnub-plotly",
       message: data,
       callback: function(m){console.log(m)}
   });
});
cronJob.start();
pubnub-plotly.js
For script below, you should use Plotly Node.js SDK, as there is client side JS variation too. You need to spend some time to go through the docs of Plotly SDK to understand how they expect the data and render it.
Basically, here is what is happening:
- We instantiated the pubnub and plotly from their npm packages.
- First, we tell how the initial data would look like. What values x-axis and y-axis of a bar graph will contain.
- Then, we specify a couple of features about the generated graph, like file name, layout etc.
- After that we plot the graph with graph options and initial data, which gets rendered.
- Then it creates the stream to accept the data. Inside that stream, we mention the PubNub’s channel from where the data stream comes in.
- We parse the incoming data in the way plotly expects it to receive on the y-axis and write to that stream.
var pubnub = require("pubnub")({
   subscribe_key: 'demo' // always required
});
var plotly = require('plotly')(‘<PLOTLY USERNAME>’,’<API KEY>’);
var stream_token = 'n2g7l2m0la'
var initData = [{
   x:['Event1', 'Event2', 'Event3'],
   y:[],
   name: 'sample',
   type: 'bar',
   stream:{
       token: stream_token,
       maxpoints:200
   }
}];
var layout = {barmode: "stack"};
var initGraphOptions = {fileopt : "extend", filename : "pubnub-plotly-file", layout: layout};
plotly.plot(initData, initGraphOptions, function (err, msg) {
 if (err) return console.log(err)
 console.log(msg);
 var stream1 = plotly.stream(stream_token, function (err, res) {
   console.log(err, res);
   clearInterval(loop); // once stream is closed, stop writing
 });
 var loop = function () {
   pubnub.subscribe({
       channel: "pubnub-plotly",
       message : function(message){
           var arr = new Array(3)
           message.find(function(event){
               if (event.event_name == "Event1"){
                   arr[0] = event.data ;
               } else if (event.event_name == "Event2"){
                   arr[1] = event.data ;
               } else if (event.event_name == "Event3"){
                   arr[2] = event.data ;
               }
           })
           console.log(arr);
           var streamObject = JSON.stringify({y : arr });
           console.log(streamObject);
           stream1.write(streamObject+'<br />');
       }
   });
 };
});
Wrapping Up
So that's it! We hope you enjoyed this simple guide to connecting Plotly and PubNub. We love Plotly because it doesn't just do visualizations, but data analysis as well. We don't just stream to our dashboard, but also to do ETL (Extract Transform and Load).
With a wide variety of chart types, like head maps, scatter plots, and geographical maps, you've got a ton of flexibility as to how you want to visualize your data.