Tracking Real-time Custom Metrics Apps with Librato API
Librato is a cloud monitoring platform that allows developers and operations professionals to monitor and analyze metrics at all levels of the stack, and includes a suite of features for analyzing and alerting based on metrics that matter.
We're excited to announce our new Librato block, which lets you gather metrics based on your real-time data streams, process the data, and visualize it on a live-updating dashboard or chart. For example, with a large scale real-time collaborative app deployment, operations team can monitor user activity, and if a certain number of errors are returned, Librato will alert the right engineering or support teams.
Analyzing and Visualizing Data with the Librato Block
In this article, we'll dive into a simple example of how to track and display custom metrics from a real-time AngularJS web app.
As anyone running a large-scale application will attest, tracking technical and business metrics is vital to ensuring continuity of service, business health, and recovering from issues quickly. The Librato Monitoring API is a powerful way to track, display, and disseminate metrics quickly, providing rapid insight and rapid response capabilities for your application.
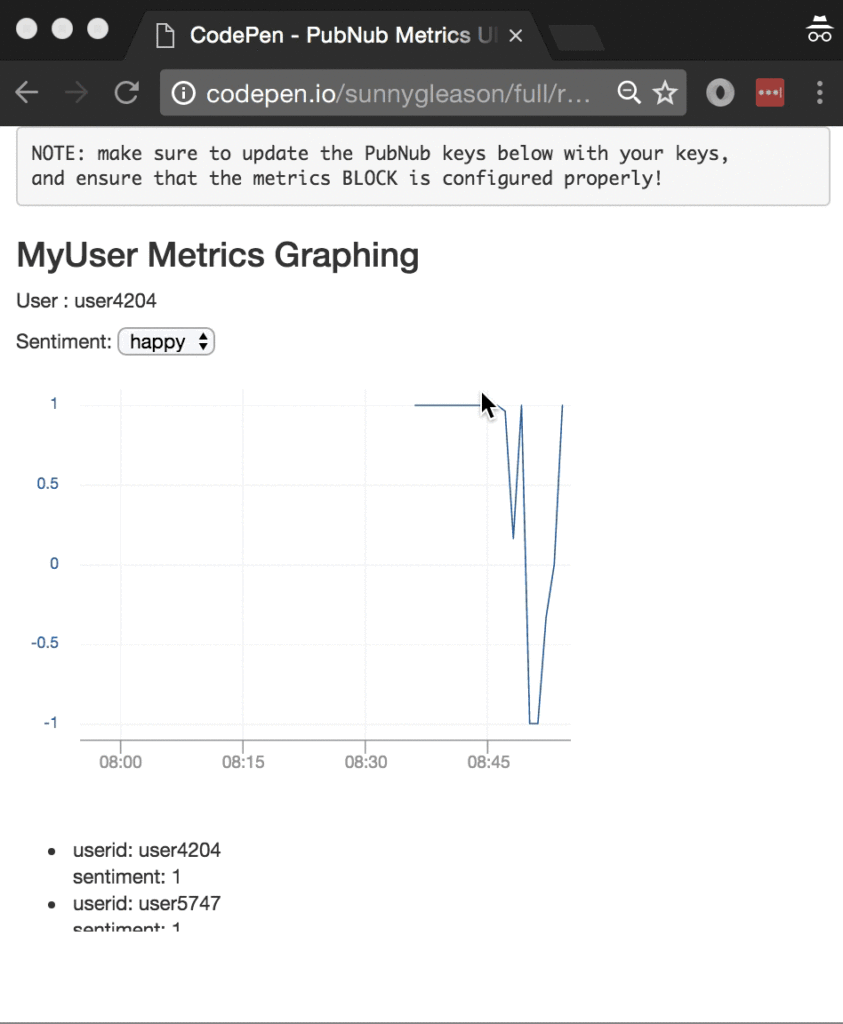
So, what exactly are these monitoring web services we speak of? Librato offers a number of services for creating, displaying and alerting on metrics. In this article, Monitoring refers to tracking data for specified metrics over time. There are many considerations when monitoring, such as time series interval, granularity, accuracy, format, composite functions, tracking of gaps, and overall retention and aggregation of data.
As we prepare to explore our sample AngularJS web application with monitoring features, let's check out the underlying Librato API.
Librato API

Large-scale monitoring and metrics analysis is a notoriously difficult area, and it requires substantial effort and engineering resources to maintain high availability and high efficiency in a metrics collection system. Librato provides a solution to these issues with a friendly UI and easy-to-use API that “just works.” Through the
Through the API and user interface, it is possible to track new metrics, create charts from simple and compound metrics, organize charts into spaces, and even download snapshot images of charts at specific points in time.
Obtaining your PubNub Developer Keys
The first thing you'll need before you can create a real-time application with PubNub are your publish and subscribe keys. Just in case you haven't already, you can create an account, get your keys and be ready to use the PubNub network. Once you do that, the publish and subscribe keys look like UUIDs and start with “pub-c-” and “sub-c-” prefixes respectively. Keep those handy – you'll need to plug them in when initializing the PubNub object in your HTML5 app below.
About the PubNub JavaScript SDK
PubNub plays together really well with JavaScript because the PubNub JavaScript SDK is extremely robust and has been battle-tested over the years across a huge number of mobile and backend installations. The SDK is currently on its 4th major release, which features a number of improvements such as isomorphic JavaScript, new network components, unified message/presence/status notifiers, and much more.
NOTE: for compatibility with the PubNub AngularJS SDK, our UI code will use the PubNub JavaScript v3 API syntax. We expect the AngularJS API to be v4-compatible soon. In the meantime, please stay alert when jumping between different versions of JS code!
Getting Started with Librato API
The next thing you'll need to get started with Librato API is a Librato account to take advantage of the monitoring APIs.
- Step 1: go to the Librato signup form.
- Step 2: create an account, making note of the username and password.
- Step 3: go to the API tokens (
https://metrics.librato.com/account/tokens) page, and create a new record-only token (keep track of this for a future step).
- Step 4: go to the spaces page. This is where you will create your new space and chart in a future step.
All in all, not too shabby!
Setting up the BLOCK
With PubNub BLOCKS, it's really easy to create code to run in the network. Here's how to make it happen:
- Step 1: go to the application instance on the PubNub admin dashboard.
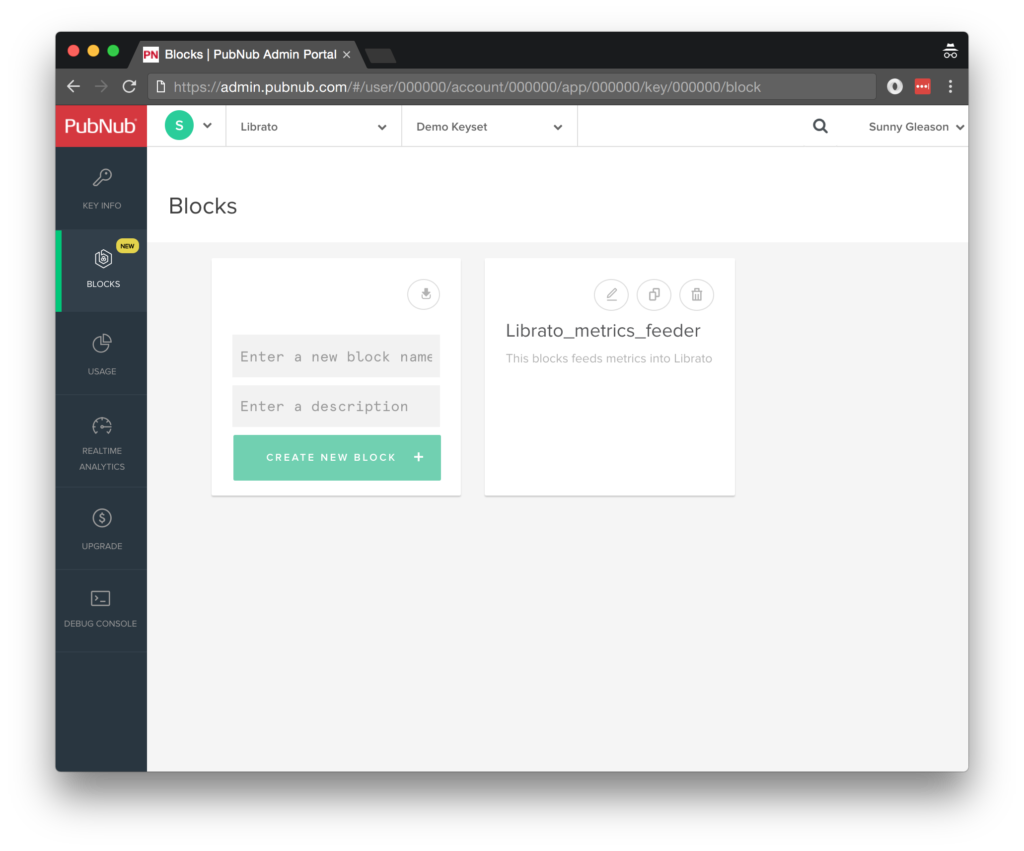
- Step 2: create a new BLOCK.
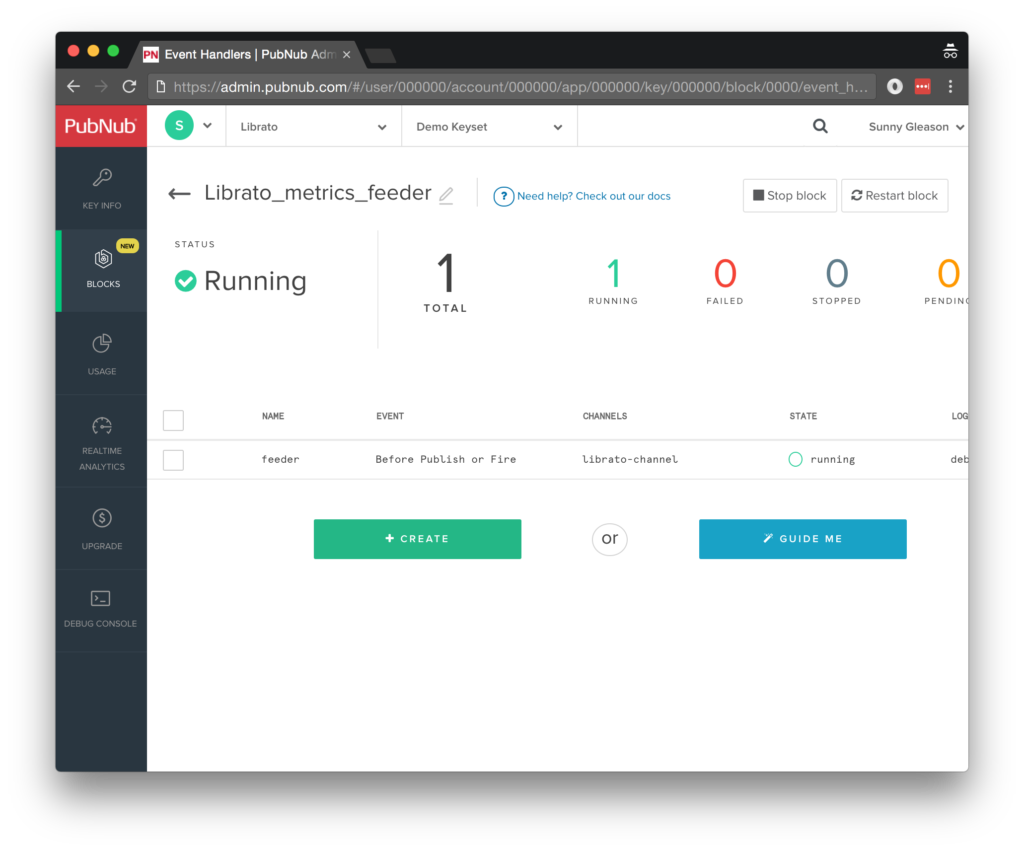
- Step 3: paste in the BLOCK code from the next section and update the credentials with the Librato API token credentials from the previous steps above.
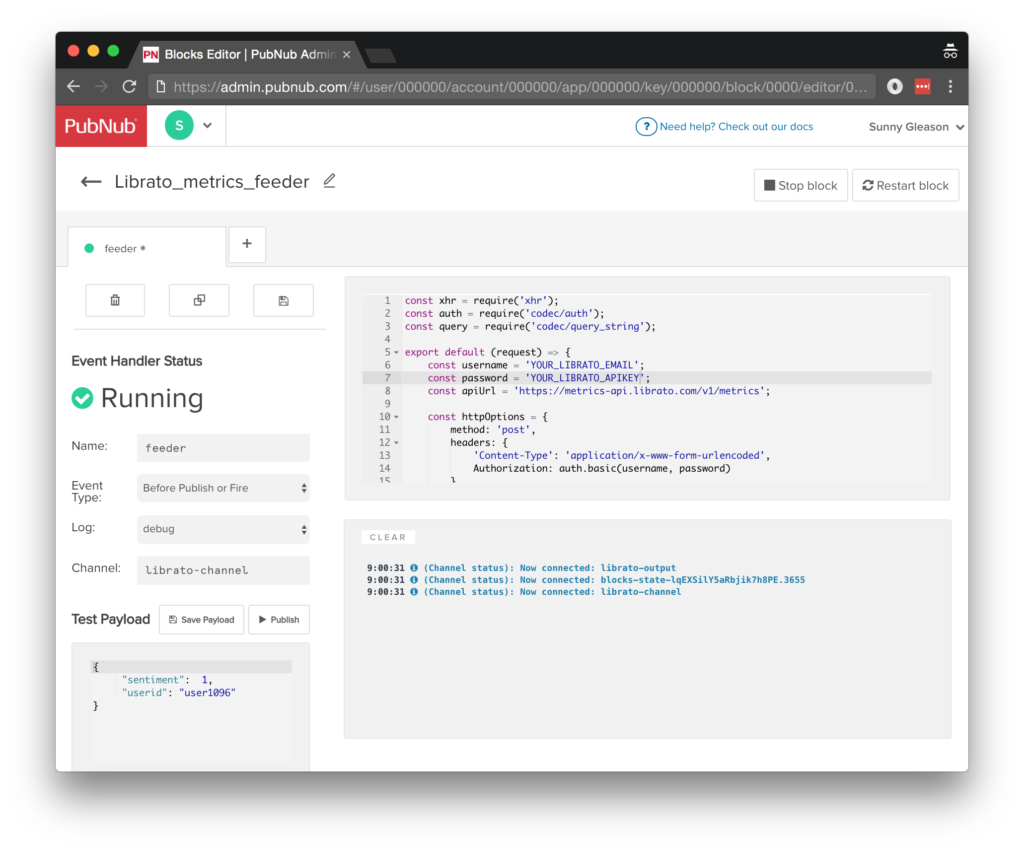
- Step 4: Start the BLOCK, and test it using the “publish message” button and payload on the left-hand side of the screen.
That's all it takes to create your serverless code running in the cloud!
Diving into the Code – the BLOCK
You'll want to grab the 32 lines of BLOCK JavaScript and save them to a file, say, pubnub_librato_block.js. It's available as a Gist on GitHub for your convenience.
First up, we create a method to handle incoming messages, and declare our dependencies on xhr, query, and auth (for HTTP requests).
const xhr = require('xhr');
const auth = require('codec/auth');
const query = require('codec/query_string');
export default (request) => {
Next up, we declare variables for the API endpoint, username and API token.
  const username = 'YOUR_LIBRATO_EMAIL';
  const password = 'YOUR_LIBRATO_APIKEY';
  const apiUrl = 'https://metrics-api.librato.com/v1/metrics';
Next, we set up the HTTP options for the metrics API request. We use POST to store the metrics value. We use HTTP Basic Authentication for the API, and post a sentiment value object with 3 parts: the numeric value (in our case, we use the values -1, 0 or 1 to signify sad/neutral/happy), userid (to identify the unique source of the metric), and measure
  const httpOptions = {
      method: 'post',
      headers: {
          'Content-Type': 'application/x-www-form-urlencoded',
          Authorization: auth.basic(username, password)
      },
      body: query.stringify({
        "gauges[sentiment]":  request.message.sentiment,
        "gauges[sentiment][source]":  request.message.userid,
        "gauges[sentiment][measure_time]":  parseInt(new Date().getTime() / 1000)
      })
  };
Finally, we call the metrics collection endpoint with the given metrics data, store the metrics result in the metrics_result attribute, and catch any errors and log to the BLOCKS console. Pretty easy!
    return xhr.fetch(apiUrl, httpOptions)
    .then((r) => {
        request.message.metric_result = r;
        return request.ok();
    })
    .catch((e) => {
        console.error(e);
        return request.ok();
    });
};
All in all, it doesn't take a lot of code to add metrics collection to your application. We like that!
Let's move on to the UI.
Diving into the Code – the User Interface
You'll want to grab these 94 lines of HTML & JavaScript and save them to a file, say, pubnub_librato_ui.html.
The first thing you should do after saving the code is to replace two values in the JavaScript:
- YOUR_PUB_KEY: with the PubNub publish key mentioned above.
- YOUR_SUB_KEY: with the PubNub subscribe key mentioned above.
If you don't, the UI will not be able to communicate with anything and probably clutter your console log with entirely too many errors.
For your convenience, this code is also available as a Gist on GitHub, and a Codepen as well. Enjoy!
Dependencies
First up, we have the JavaScript code & CSS dependencies of our application.
<!doctype html>
<html>
<head>
  <script src="https://cdn.pubnub.com/pubnub-3.15.1.min.js"></script>
  <script src="https://ajax.googleapis.com/ajax/libs/angularjs/1.5.6/angular.min.js"></script>
  <script src="https://cdn.pubnub.com/sdk/pubnub-angular/pubnub-angular-3.2.1.min.js"></script>
  <script src="https://cdnjs.cloudflare.com/ajax/libs/underscore.js/1.8.3/underscore-min.js"></script>
  <link rel="stylesheet" href="//netdna.bootstrapcdn.com/bootstrap/3.0.2/css/bootstrap.min.css" />
  <link rel="stylesheet" href="https://maxcdn.bootstrapcdn.com/font-awesome/4.6.3/css/font-awesome.min.css" />
</head>
<body>
For folks who have done front-end implementation with AngularJS before, these should be the usual suspects:
- PubNub JavaScript client: to connect to our data stream integration channel.
- AngularJS: were you expecting a niftier front-end framework? Impossible!
- PubNub Angular JavaScript client: provides PubNub services in AngularJS quite nicely indeed.
- Underscore.js: we could avoid using Underscore.JS, but then our code would be less awesome.
In addition, we bring in 2 CSS features:
- Bootstrap: in this app, we use it just for vanilla UI presentation.
- Font-Awesome: we love Font Awesome because it lets us use truetype font characters instead of image-based icons. Pretty sweet!
Overall, we were pretty pleased that we could build a nifty UI with so few dependencies. And with that… on to the UI!
The User Interface
Here's what we intend the UI to look like:
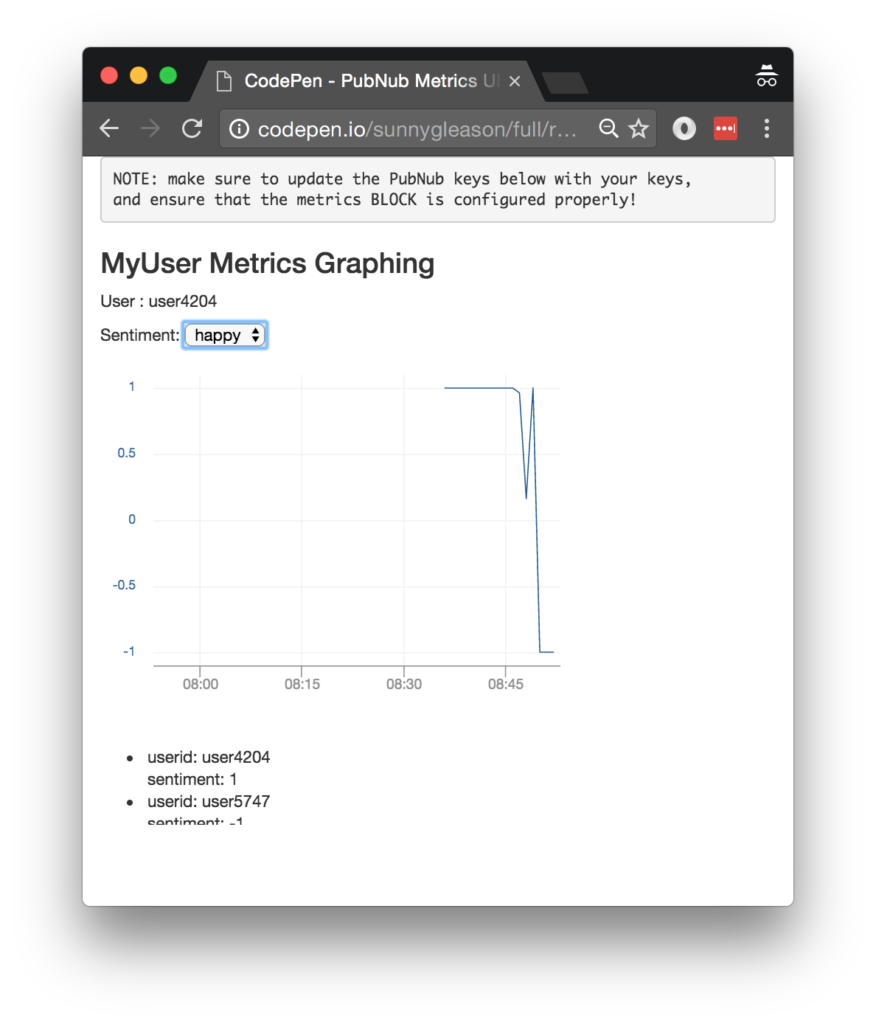
The UI is pretty straightforward – everything is inside a div tag that is managed by a single controller that we'll set up in the AngularJS code. We also display the unique userid that we generate in the controller for each browser instance of the application.
<div class="container" ng-app="PubNubAngularApp" ng-controller="MyMetricsCtrl">
<pre>
NOTE: make sure to update the PubNub keys below with your keys,
and ensure that the metrics BLOCK is configured properly!
</pre>

<h3>MyUser Metrics Graphing</h3>
<p>User : {{userid}}</p>
We provide a simple select chooser for the user's sentiment. Sentiment values are sent to the PubNub channel automatically every 30s, as you'll see later in the controller.
<div>
  Sentiment:
  <select ng-model="sentiment">
    <option value="1">happy</option>
    <option value="0">neutral</option>
    <option value="-1">sad</option>
  </select>
</div>
We embed a Librato chart in our application. This is where you'll want to go to the spaces page in your Librato account to create a new space and new chart for the sentiment metric. You can see the chartid in the “embed chart” menu option on the chart.
If the `sentiment` metric isn't showing up, try sending a few test values into the API using the BLOCK console or cURL API example in the Librato API documentation. Make sure to change the YOURLIBRATOEMAIL and YOURLIBRATO
<div class="librato-display-media"
     data-chart_id="YOUR_LIBRATO_CHARTID"
     data-duration="3600"
     data-width="400"
     data-height="300"
     data-source="*">
</div>
<script type="text/javascript"
        src="https://sdk.librato.com/librato-sdk-v1.0.0-min.js"
        charset="utf-8"
        data-librato_email="YOUR_LIBRATO_EMAIL"
        data-librato_token="YOUR_LIBRATO_APIKEY">
</script>
Our UI consists of a simple list of the data values. We iterate over the values in the controller scope using a trusty ng-repeat. Each message includes the value of the sentiment and the corresponding userid.
NOTE: when multiple users are viewing the UI, all of their metrics will be displayed in the list, and the chart will display the average sentiment (if you've set it up using the default chart configuration).
<ul>
  <li ng-repeat="message in messages track by $index">
    userid: {{message.userid}}
    <br />
    sentiment: {{message.sentiment}}
  </li>
</ul>
</div>
And that's it – a functioning real-time UI in just a handful of code (thanks, AngularJS)!
The AngularJS Code
Right on! Now we're ready to dive into the AngularJS code. It's not a ton of JavaScript, so this should hopefully be pretty straightforward.
The first lines we encounter set up our application (with a necessary dependency on the PubNub AngularJS service) and a single controller (which we dub MyMetricsCtrl). Both of these values correspond to the ng-app and ng-controller attributes from the preceding UI code. We also add a dependency on the $interval object so we can use JavaScript interval timers seamlessly.
<script>
angular.module('PubNubAngularApp', ["pubnub.angular.service"])
.controller('MyMetricsCtrl', function($rootScope, $scope, $interval, Pubnub) {
Next up, we initialize a bunch of values. First is a random userid for uniqueness. Next is the default sentiment of 1 (happy). Then, we create an array of message objects which starts out empty. After that, we set up the channel as the channel name where we will send and receive real-time structured data messages.
NOTE: make sure this matches the channel specified by your BLOCK configuration!
  $scope.userid    = 'user' + parseInt(Math.random() * 10000);
  $scope.sentiment = '1';
  $scope.messages  = [];
  $scope.channel   = 'librato-channel';
We initialize the Pubnub object with our PubNub publish and subscribe keys mentioned above, and set a scope variable to make sure the initialization only occurs once. NOTE: this uses the v3 API syntax.
  if (!$rootScope.initialized) {
    Pubnub.init({
      publish_key: 'YOUR_PUB_KEY',
      subscribe_key: 'YOUR_SUB_KEY',
      ssl:true
    });
    $rootScope.initialized = true;
  }
The next thing we'll need is a real-time message callback called msgCallback; it takes care of all the real-time messages we need to handle from PubNub. In our case, we have only one scenario – an incoming message containing the metrics value. The unshift() operation should be in a $scope.$apply() call so that AngularJS gets the idea that a change came in asynchronously.
  var msgCallback = function(payload) {
    $scope.$apply(function() {
      $scope.messages.unshift(payload);
    });
  };
The publish() function takes the sentiment value and userid, and publishes them as a structured data object to the PubNub channel.
  $scope.publish = function() {
    Pubnub.publish({
      channel: $scope.channel,
      message: {userid:$scope.userid, sentiment:$scope.sentiment}
    });
  };
We don't call the publish() function from the UI – we set up an interval timer to publish it every 30s.
$interval($scope.publish, 30000);
In the main body of the controller, we subscribe() to the message channel (using the JavaScript v3 API syntax) and bind the events to the callback function we just created.
Pubnub.subscribe({ channel: [$scope.channel], message: msgCallback });
We mustn't forget to close out the HTML tags accordingly.
});
</script>
</body>
</html>
Conclusion
Thank you so much for joining us in the Librato Monitoring API article of our real-time web application series! Hopefully it's been a useful experience learning about metrics-enabled technologies. In future articles, we'll dive deeper into more web service APIs and use cases for PubNub BLOCKS in real time web applications.
Stay tuned, and please reach out anytime if you feel especially inspired or need any help!