Usage & Monitoring
The Usage & Monitoring section displays both Billable and Monitoring metrics. You can view the metrics of all your apps or specific apps and keysets.
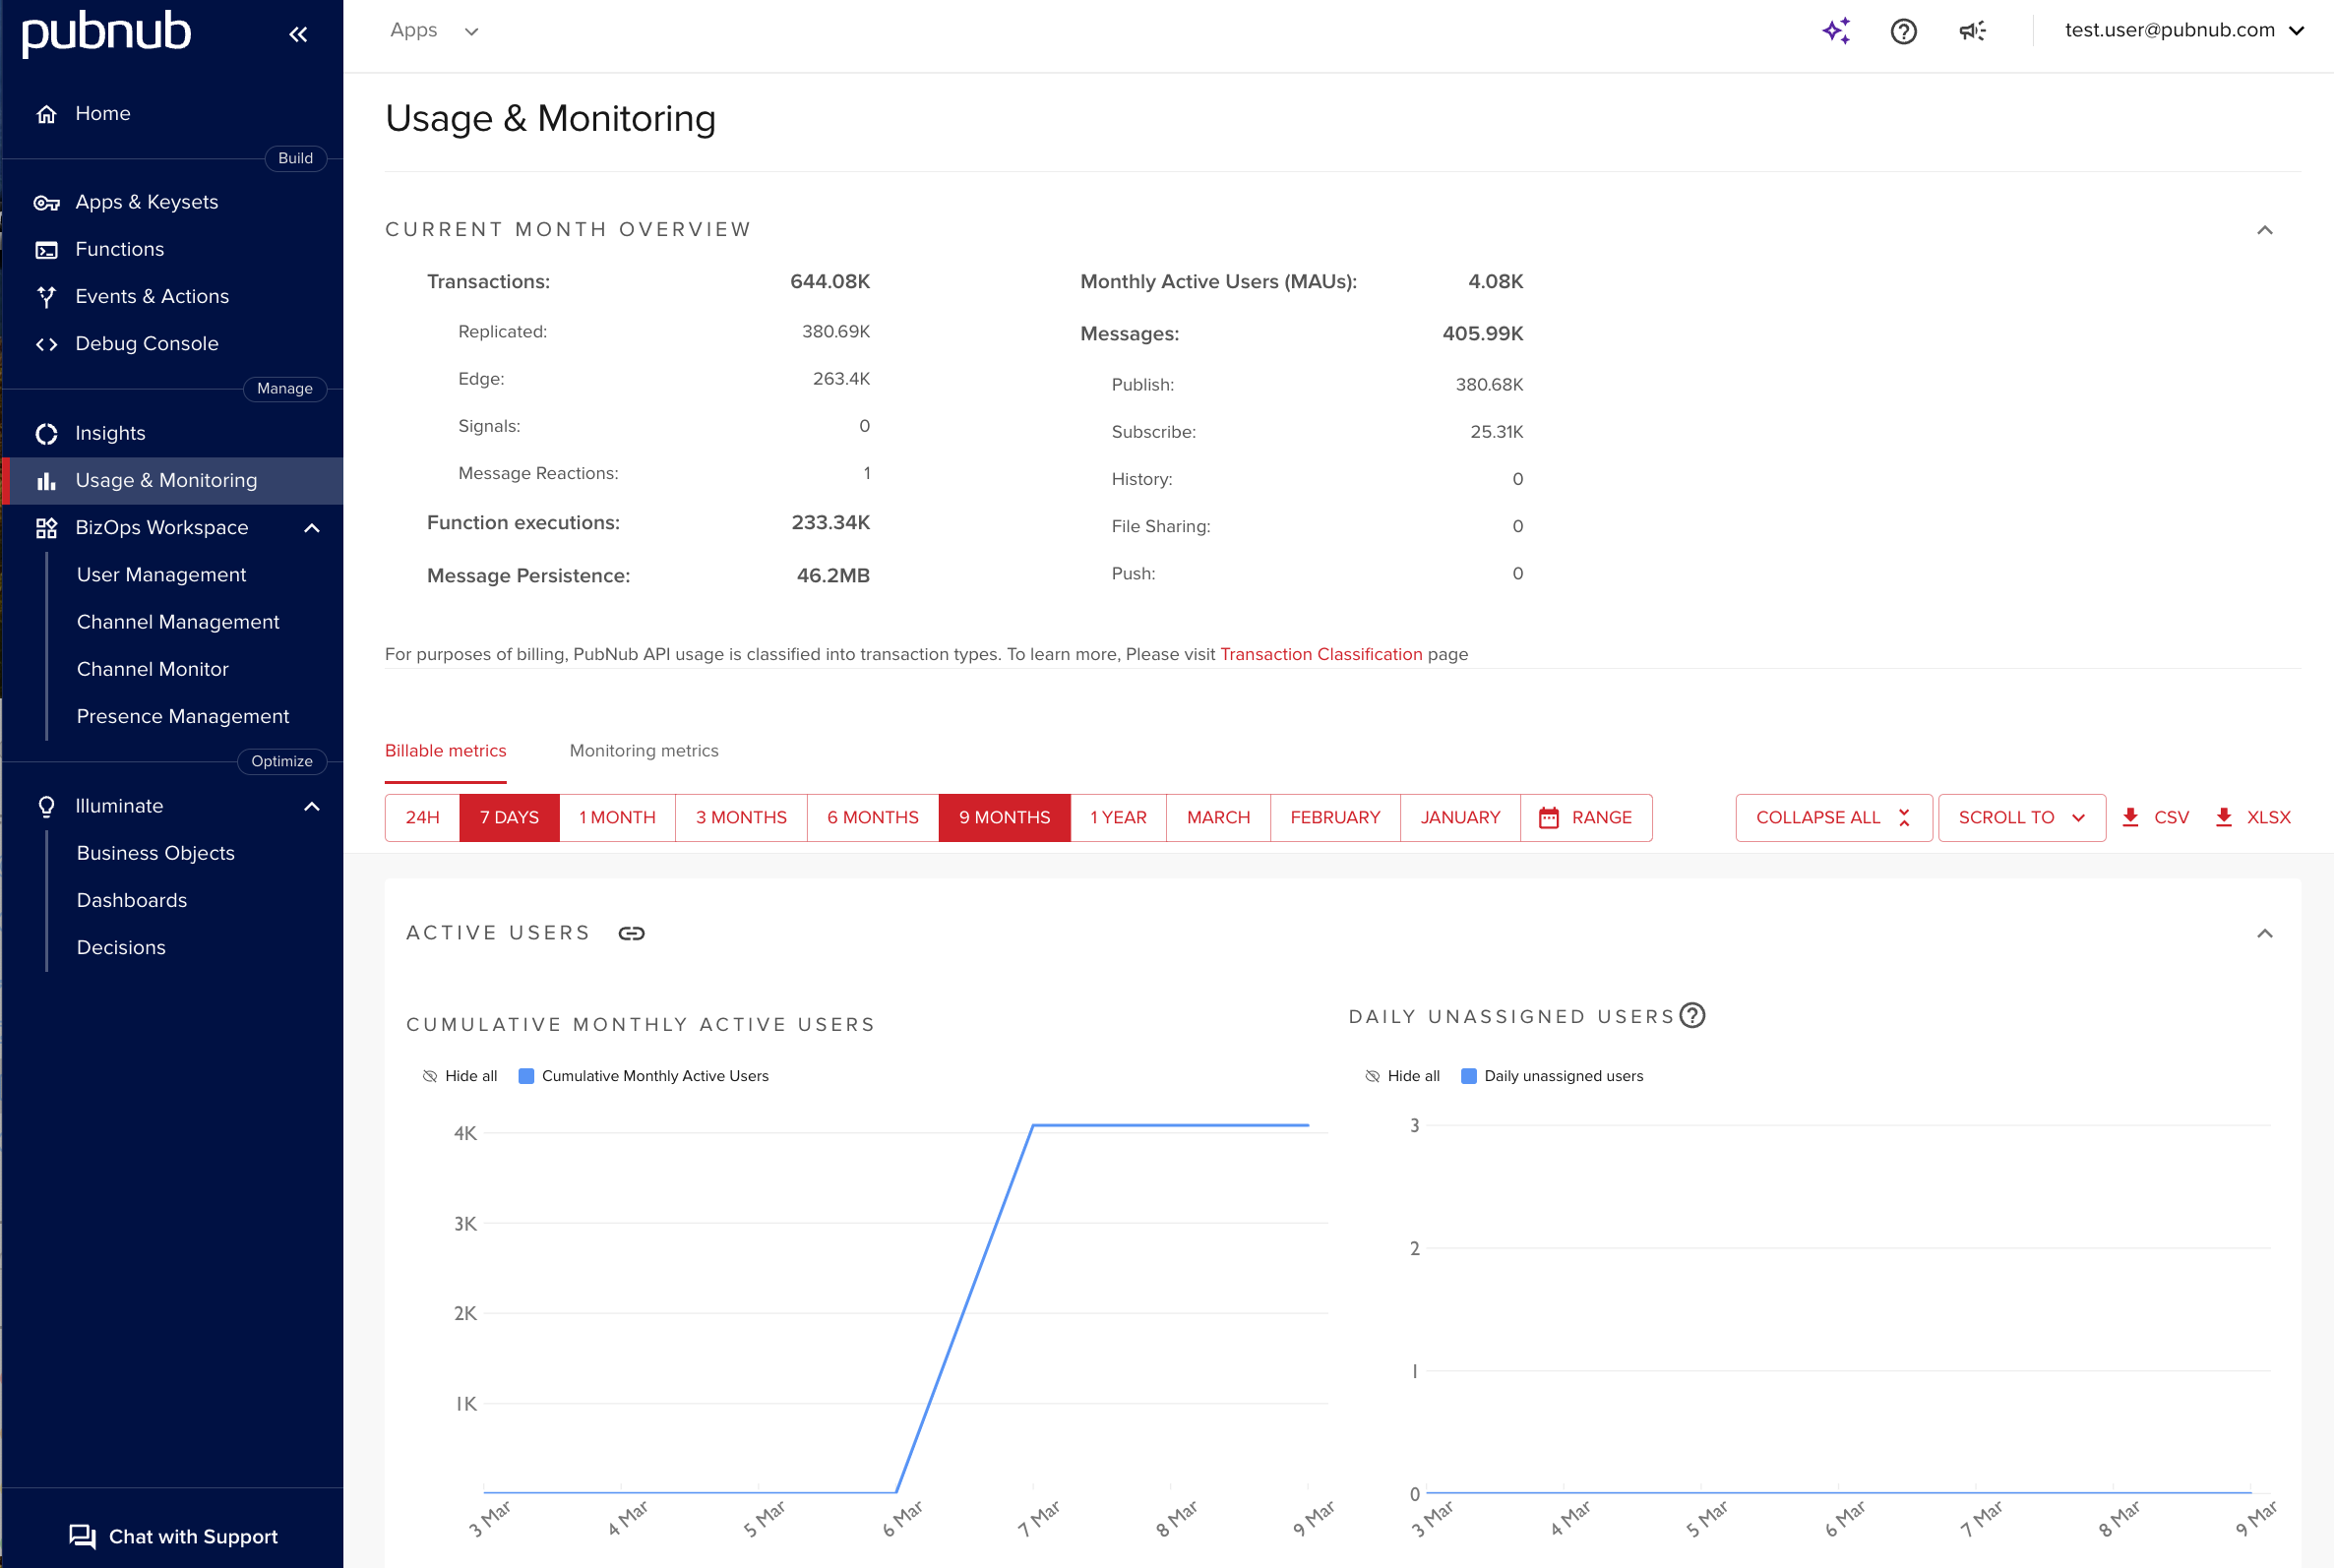
Current month
This chart displays statistics for the month to date, split by:
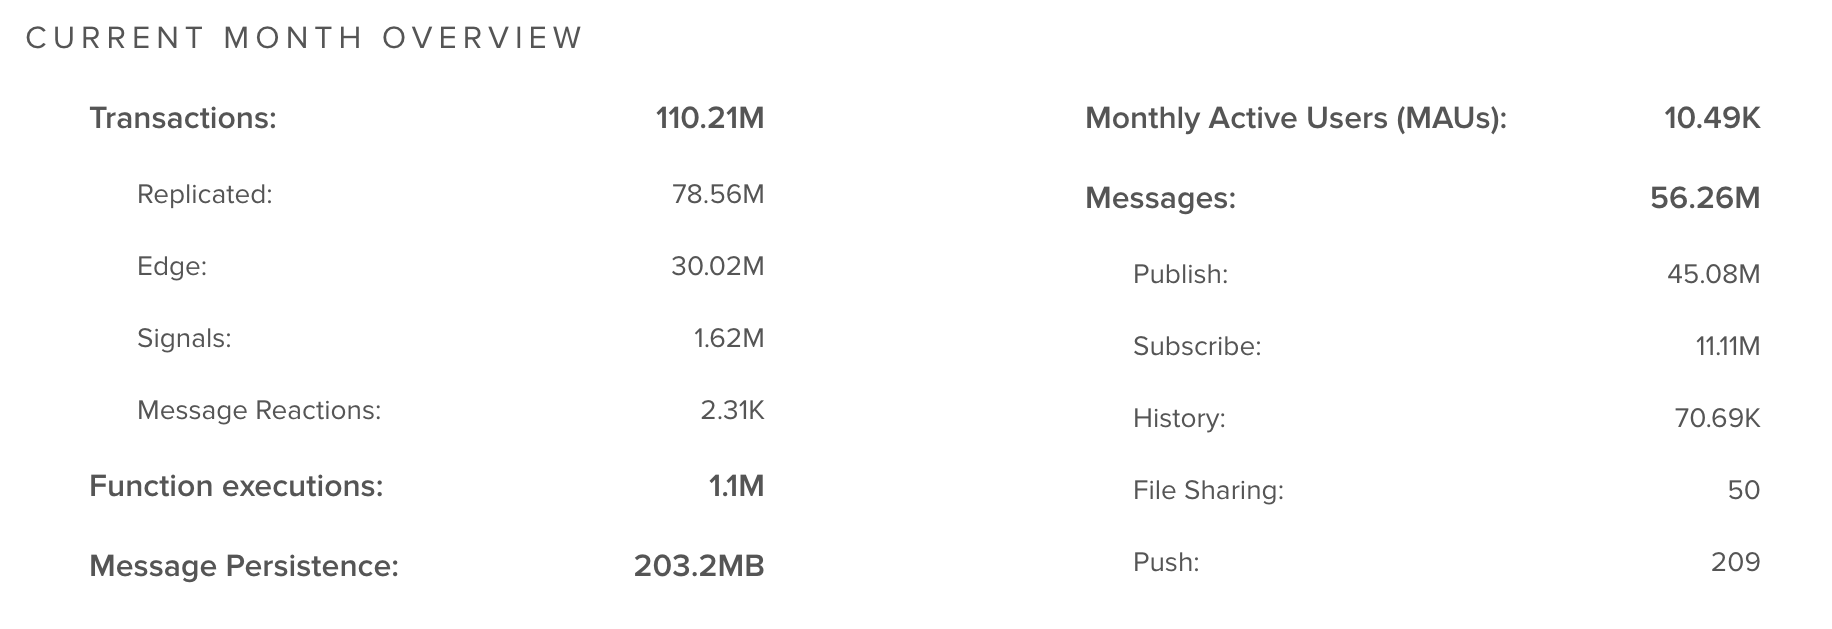
- Transactions
- Replicated
- Edge
- Signals
- Message Reactions
- Functions Executions
- Message Persistence
- Monthly Active Users (MAU)
- Messages
Apart from the current month's usage stats, you can also have a much more in-depth look at statistics in a graphical form within other timeframes, including 24 hours, 7 days, 1 - 9 months, and a custom range, where you can choose specific dates for which you want to display metrics.
Metrics retention time
For free accounts, most of the metrics are kept for up to 90 days. For paid accounts, the maximum retention time is 6 months (Starter plan) or 12 months (Pro plan). Choosing a time range longer than the maximum allowed time may result in metrics displaying 0.
Download usage data
You can export the data into the.xlsx or .csv format for any of the time ranges apart from the 24-hour range. To do that, select the app, keyset, and the timeframe and click the CSV or XLSX buttons to download the data in the desired format.
No app or keyset selected
If you don't select an app or a keyset, the report contains data from all apps and keysets.